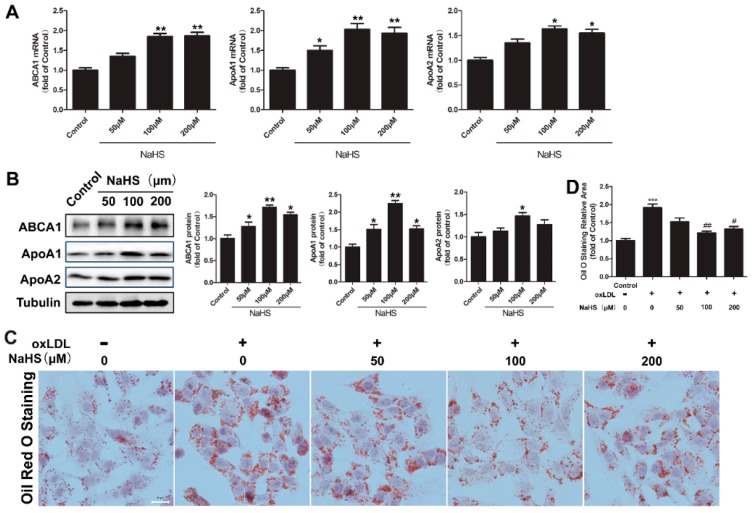
Figure 1.
Dosage effect of NaHS on the expression of ABCA1, ApoA1, and ApoA2 in HepG2 cells. (A) HepG2 cells were treated with the indicated concentration of NaHS for 6 h, followed by RNA extraction. The relative expression of ABCA1, ApoA1, and ApoA2 mRNA was quantified by quantitative reverse transcription polymerase chain reaction (RT-qPCR). Bars indicate means ± SEM of at least three independent experiments (* p < 0.05, ** p < 0.01 vs. control); (B) HepG2 cells were treated with the indicated concentration of NaHS for 24 h, followed by total cell lysate preparation. Proteins (20 μg) from total lysates were subjected to SDS-PAGE, followed by Western blot with indicated antibodies. Tubulin was used as a loading control. The blots were then quantified by ImageJ software. (n = 3, * p < 0.05, ** p < 0.01 vs. control); (C,D) HepG2 cells were co-incubated with the indicated concentration of NaHS and oxLDL (50 μg/mL) for 24 h. After incubation, cells were fixed and stained with Oil Red O. Representative images are shown in (C). The areas of positive staining were calculated with ImageJ software (*** p < 0.001 vs. control group; # p < 0.05, ## p < 0.01 vs. oxLDL treated group). Scale bar = 20 μm.

