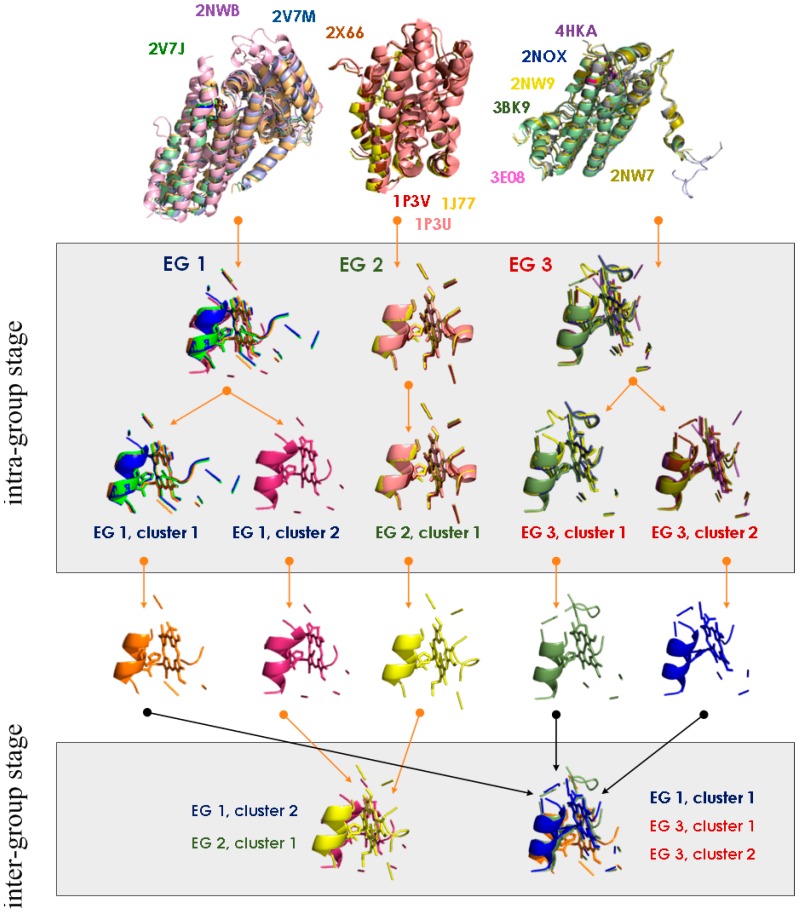
Figure 6.
MetalS2-based clustering of heme-binding MFSs. Each protein structure and its MFS correspond to a different color in all panels. The PDB codes in the top panel show the color scheme used. All MFSs are extracted from the equistructural groups (EG) in the MetalPDB database that contain a heme-binding site (exemplified by EG 1, EG 2, EG 3 in the top row). The MFSs within each EG are clustered using a stringent threshold for the MetalS2 score (2.25 in the present example [16]). Consequently, MFSs from a given EG can be grouped in one or more clusters (EG1 and EG 3 give rise to two clusters each, whereas all MFSs in EG 2 are clustered together). This is the intra-group stage. Then, for each cluster a single representative is identified, as the MFS with the lowest cumulative distance (i.e., sum of MetalS2 scores from all other MFSs in the cluster). The representative MFSs are finally clustered with a less stringent threshold and using a more relaxed hierarchical clustering approach (average rather than complete clustering). This is the inter-group stage. This clusters the MFSs regardless of the initial EG, thus putting together MFSs originally extracted from metalloproteins with different folds. This Figure was taken from [59].

