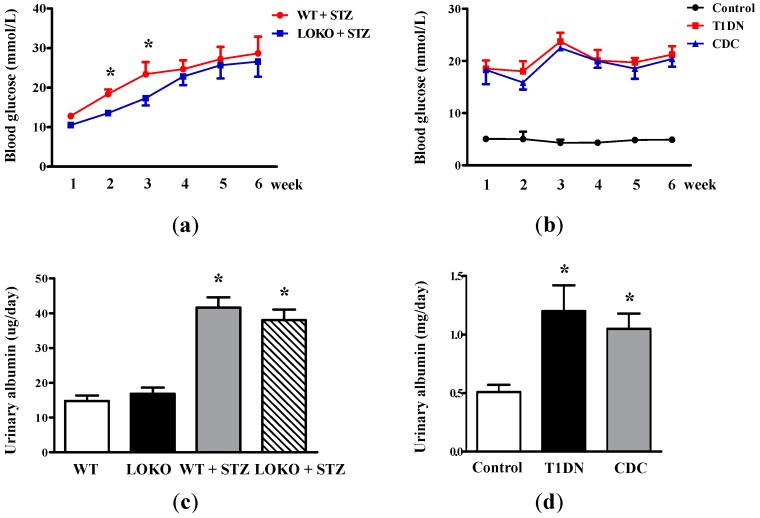
Figure 1.
Effect of 12-LO on fasting blood glucose and MAU in type-1 diabetic models. (a) Fasting blood glucose levels in WT, 12-LO knockout (12-LOKO), WT + STZ and LOKO + STZ mice; n = 9 in each group; * p < 0.01 vs. LOKO + STZ; (b) fasting blood glucose levels in control, type-1 diabetic rats and CDC-treated rats; n = 10 in each group; (c) the level of MAU in WT, LOKO, WT + STZ and LOKO + STZ mice; n = 9 in each group; * p < 0.01 vs. WT or LOKO; (d) the level of MAU in control, type-1 diabetic rats and CDC-treated rats; n = 10 in each group. Data are presented as the mean ± standard deviation (SD); * p < 0.01 vs. the control.

