Figure 6.
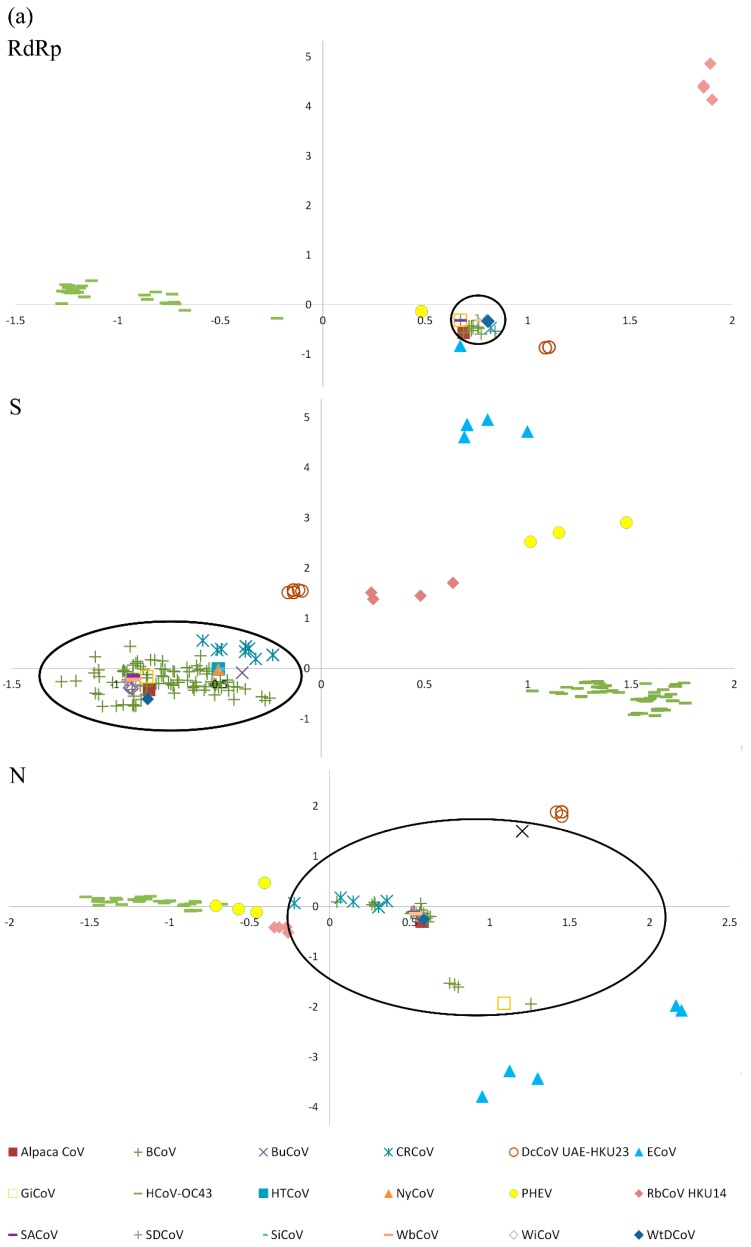
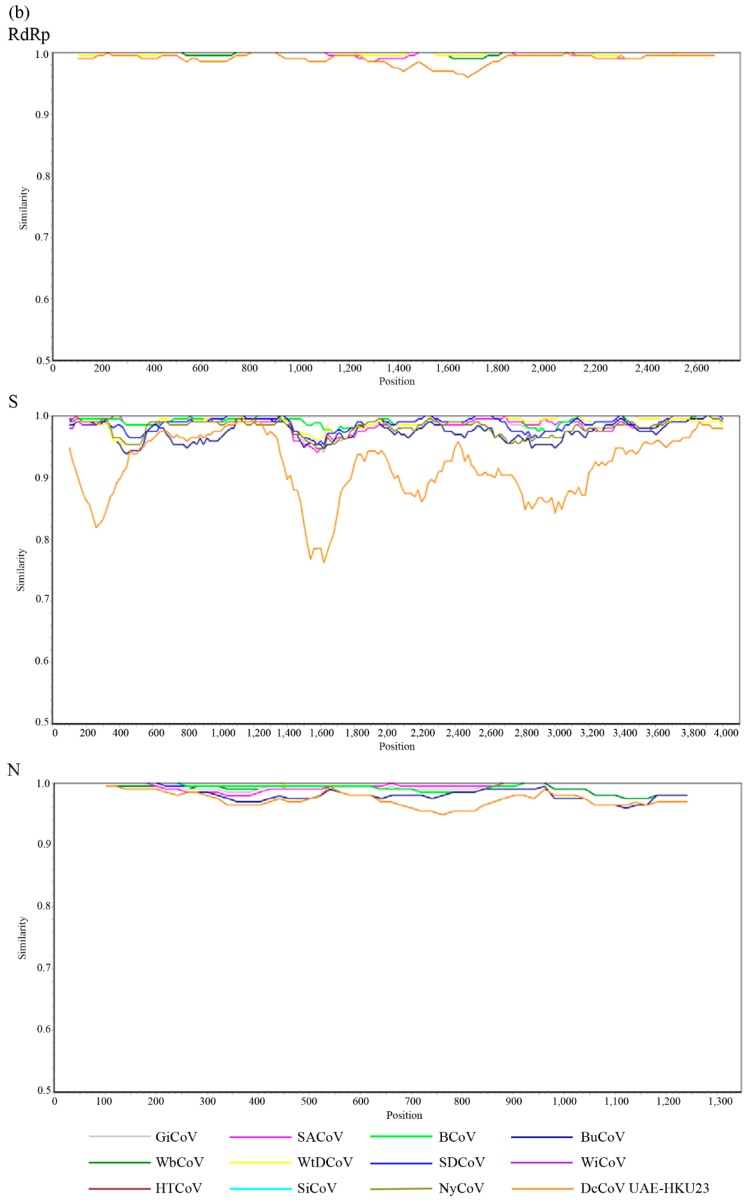
(a) Scatter plot of the corresponding analysis (CA) using relative synonymous codon usage (RSCU) of the RdRp, S, and N genes of members of Betacoronavirus 1 and RbCoV HKU14. Different coronaviruses are indicated in different colored markers. The group of bovine coronavirus-like viruses is circled; (b) SimPlot analysis of complete RdRp, S, and N genes of DcCoV UAE-HKU23, alpaca CoV, BCoV and other wild ruminant CoVs. Each point plotted is the percent genetic distance within a sliding window of 200 nt wide, centered on the position plotted, with a step size of 20 nt. Each curve represents a comparison of the sequence data of DcCoV UAE-HKU23, BCoV, and other wild ruminant CoV strains to the reference sequence data of alpaca CoV. Alpaca CoV, alpaca coronavirus; BCoV, bovine coronavirus; BuCoV, Bubalus bubalis coronavirus; CRCoV, canine respiratory coronavirus; DcCoV, dromedary camel coronavirus, ECoV, equine coronavirus; GiCoV, giraffe coronavirus; HCoV-OC43, human coronavirus OC43; HTCoV, Himalayan tahr coronavirus; NyCoV, nyala coronavirus; PHEV, porcine hemagglutinating encephalomyelitis virus; RbCoV, rabbit coronavirus; SACoV, sable antelope coronavirus; SDCoV, sambar deer coronavirus; SiCoV, sitatunga coronavirus; WbCoV, waterbuck coronavirus; WiCoV, wisent coronavirus; WtDCoV, white-tailed deer coronavirus.


