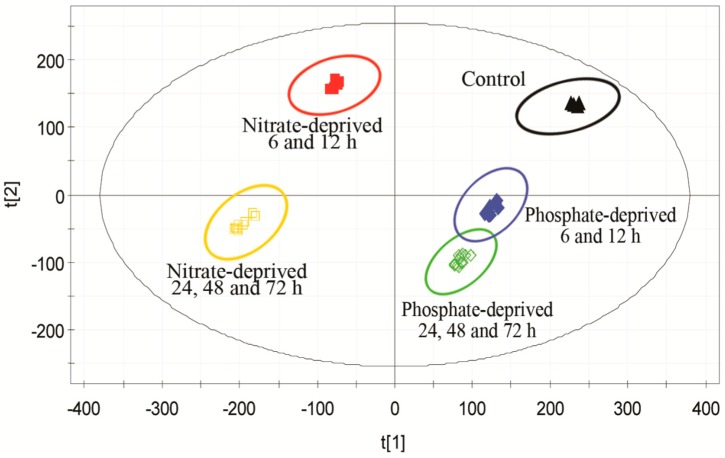
Figure 2.
Score scatter plot generated by the orthogonal partial least squares discriminant analysis (OPLS-DA) model from the peak area of the identified metabolites in the different groups. (▲) the control; (■) nitrate deprivation for 6 and 12 h; (□) nitrate deprivation for 24, 48 and 72 h; (◆) phosphate deprivation for 6 and 12 h; (◇) phosphate deprivation for 24, 48 and 72 h. t[1], the score of the first predictive component to explain the largest variation; t[2], the score of the first orthogonal component to explain the largest orthogonal variation.

