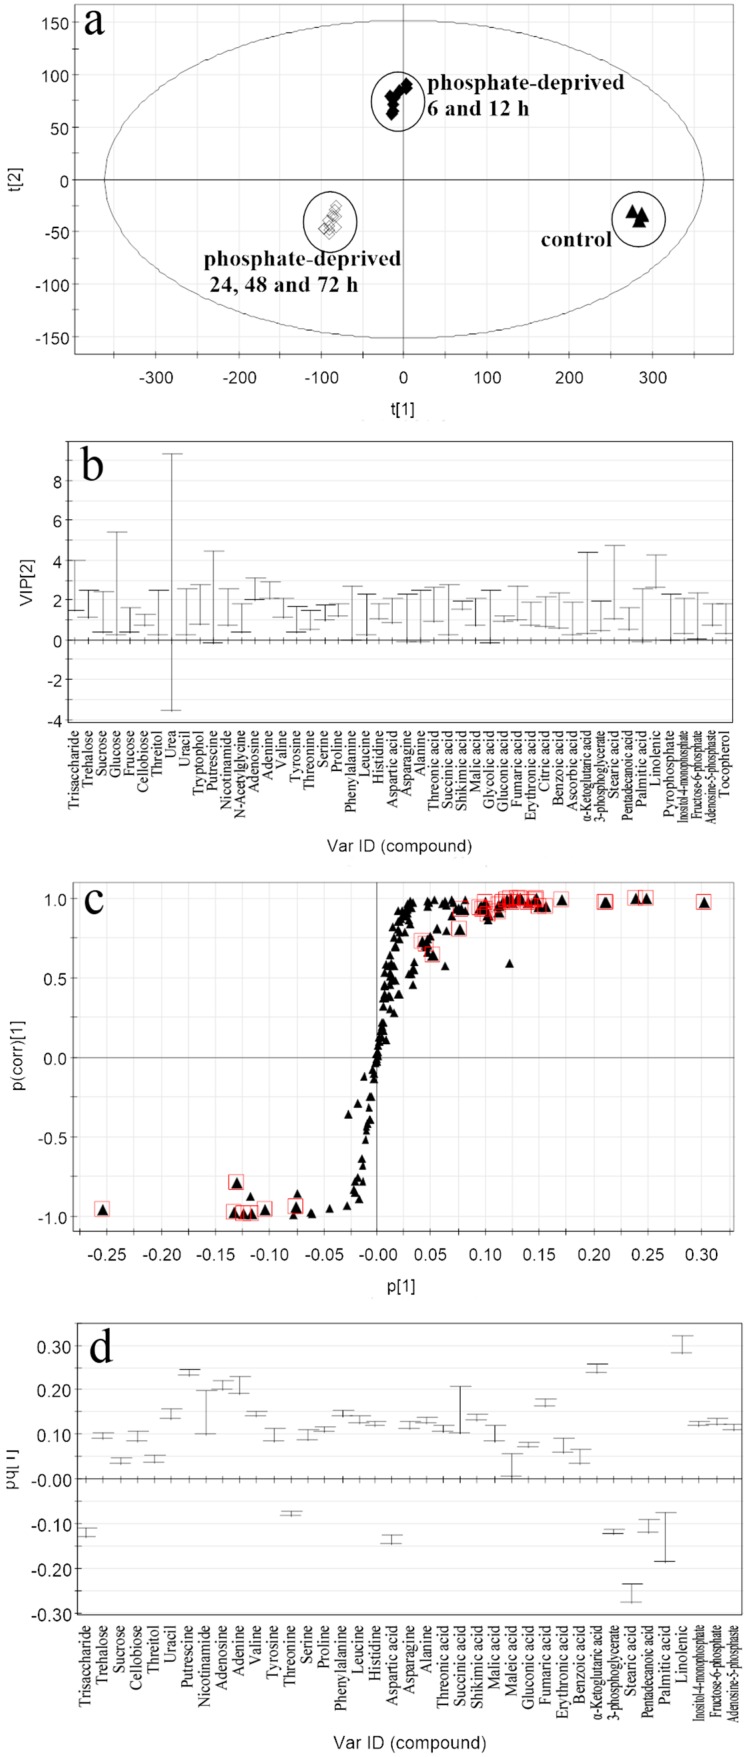
Figure 4.
Related plots of the OPLS-DA model between the phosphate-deprived group and the control. (a) Score scatter plot for metabolite discrimination. (▲) the control; (◆) phosphate-deprived group for 6 and 12 h; (◇) phosphate-deprived group for 24, 48 and 72 h; (b) VIP plot (with VIP > 1 metabolites); (c) s-plot; square marked metabolites are those with |p(corr)| > 0.6; (d) Loading column plot of the potential metabolites biomarkers.

