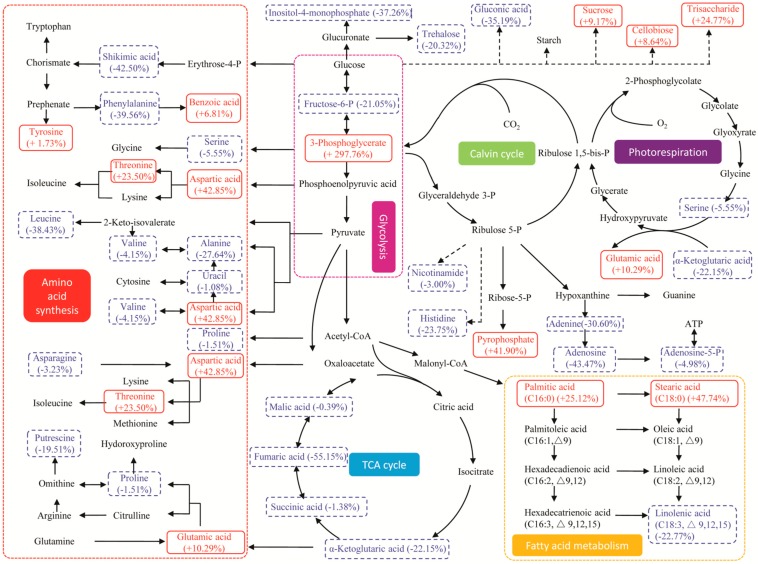
Figure 7.
Metabolic pathway and regulation visualized by KEGG under phosphate-deprived stress. Direct connections between the metabolites are indicated with solid line arrows, and putative connections between the metabolites are indicated with dash line arrows. The red words in red solid line boxes represent an increase in the abundance of the responding biomarkers, the blue words in blue dash line boxes represent a decrease in the abundance, and the black words represent no significant change. The percentages represent the change rates of the responding biomarkers by up- or down-regulation.

