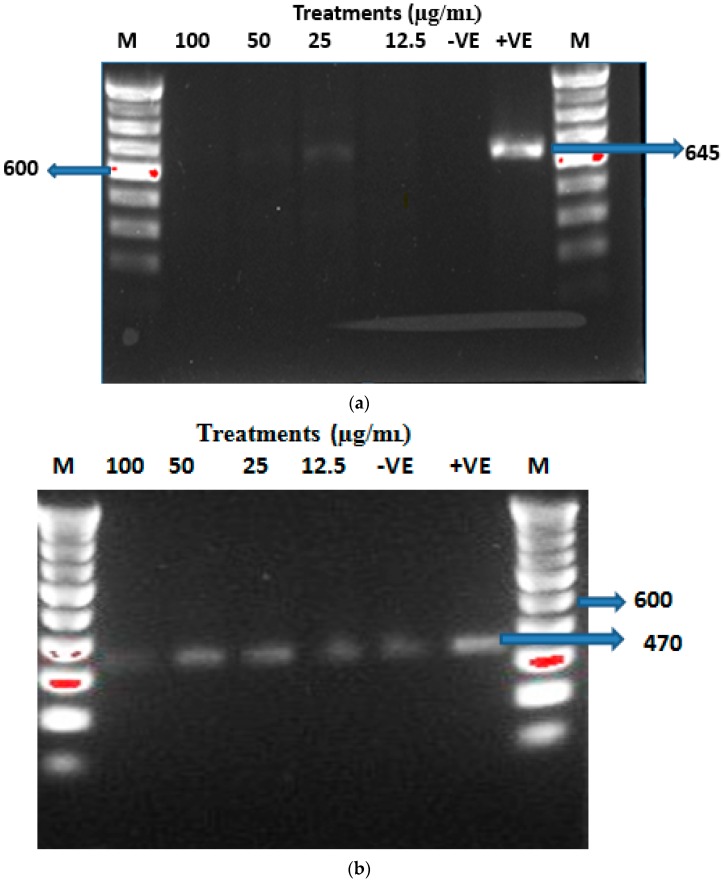
Figure 4.
RT-PCR data showing IL-1β (a) and β-actin (loading control) (b), mRNA expressions after 3 h of CSCCAN treatment. −VE, negative control or untreated cells; +VE, positive control (Treated with Bacterial lipopolysaccharides); M, molecular weight markers (100 bp); DNA ladder MW, 600; IL-1β product size, 645; β-actin product size, 470.

