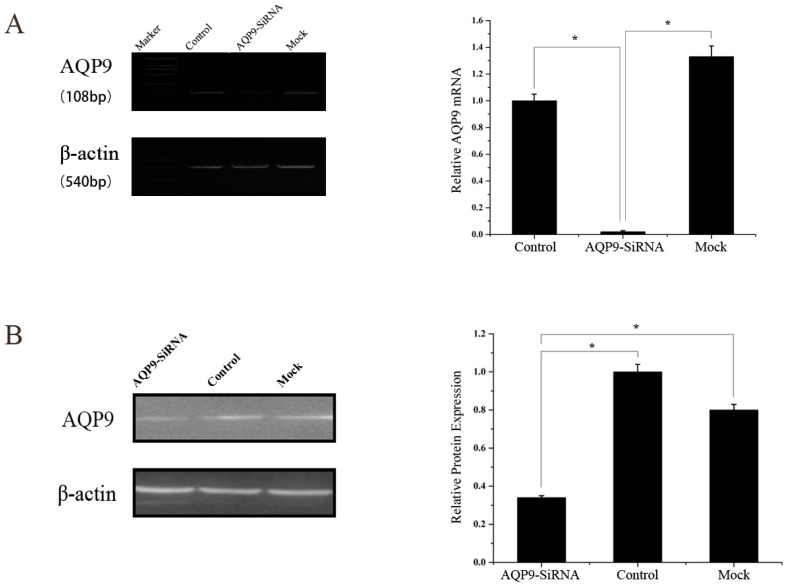
Figure 3.
Expression of AQP9 in PC3 cells, AQP9-siRNA and Mock were analyzed by real-time-PCR (A) and Western blot (B) (p < 0.05 as compared with control). △CT AQP9/β-actin (control PC3) was 6.348. Control: wild-type cells; AQP9-siRNA: cells transfected with AQP9 specific small interfering RNA; Mock: cells only treated with Lipofectamine 2000. The mean of AQP9/β-actin expression in PC-3 cells set as 1.0. Data were based on three independent experiments, and shown as mean ± SD. * p < 0.05 as compared with control.

