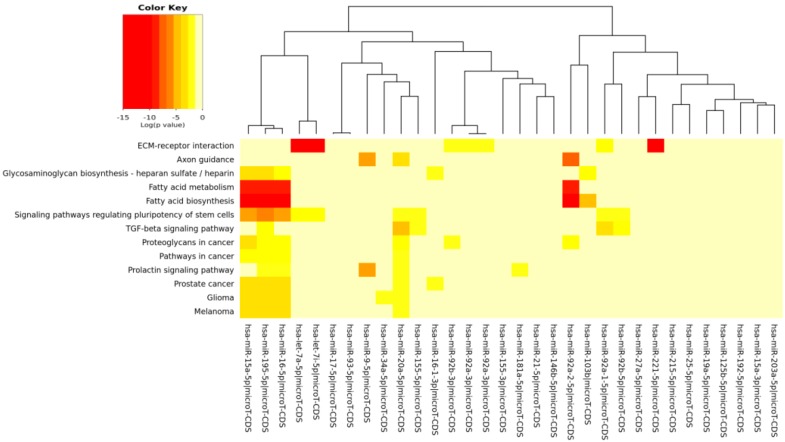
Figure 4.
MicroRNAs involved in DDR and modulated by CRC versus the pathways’ heat map. In this plot, heat map calculation is based on absolute p-values. Darker colors represent lower p-values (higher significance). The plot shows microRNAs targeting similar pathway clusters and pathways being targeted by miRNA groups.

