Figure 3.
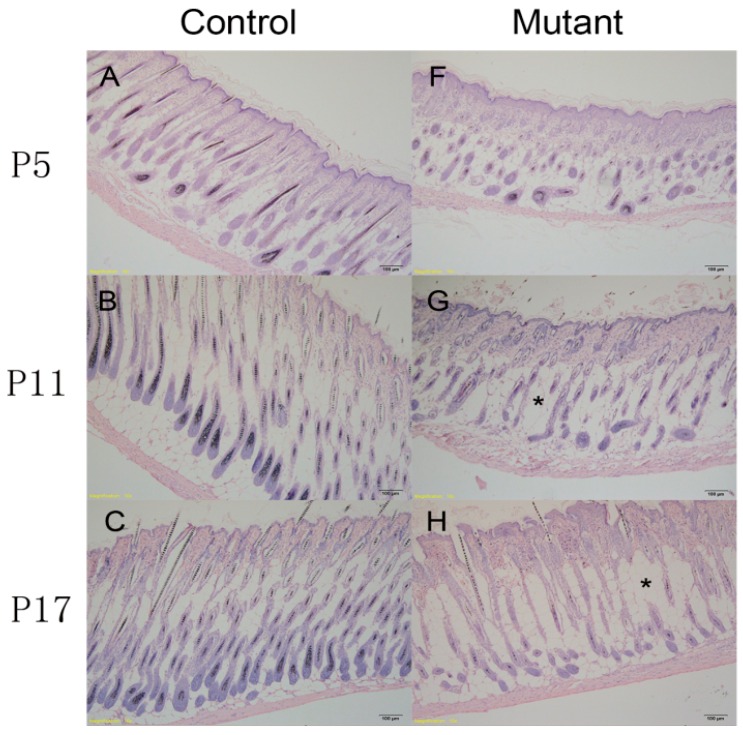
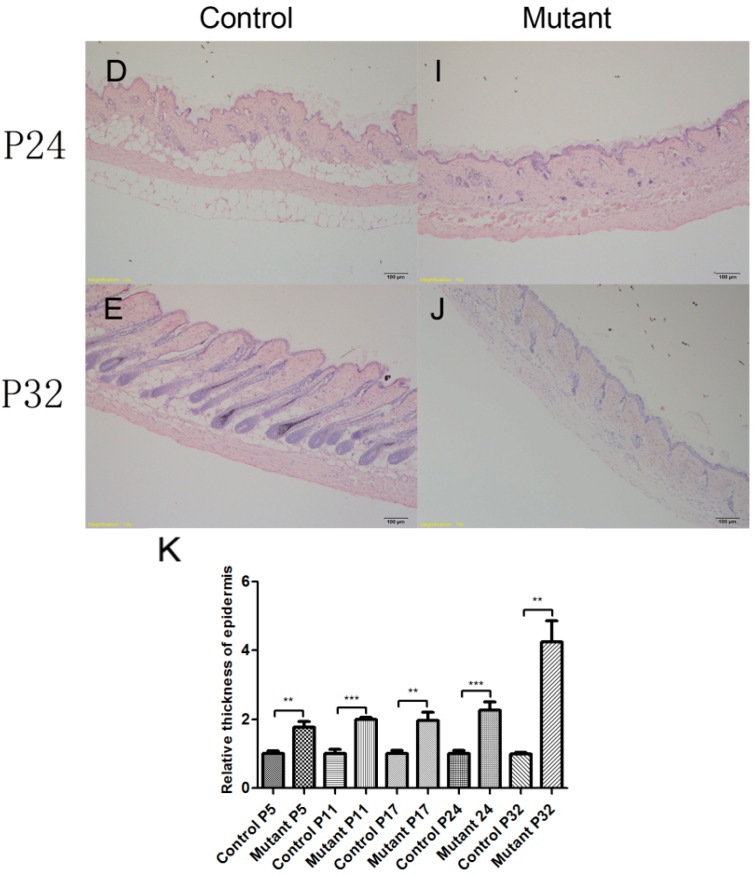
Disruption of the hair follicle cycle in Ppp2caflox/flox; Krt14-Cre mice. H&E staining of skin tissue sections from the control (A–E) and mutant (F–J) at P5 (panels A and F), P11 (panels B and G), P17 (panels C and H), P24 (panels D and I) and P32 (panels E and J). At P5, hair follicle development has no obvious difference between the control and mutant groups, which were all at the inducing follicular morphogenesis phase (panels A and F). The skin of control mice at P11 was at the anagen phase, whereas the follicles of the mutant mice were at a mixed anagen and inducing follicular morphogenesis phase (panels B and G). At P17, follicles of control mice were at the catagen phase and those of mutant mice were at a mixed anagen and catagen phase (panels C and H), respectively. At P24, the follicles of the control mice transitioned from the telogen to the anagen phases and the mutant mice were mostly at the catagen phase (panels D and I), respectively. At P32, the follicles of the control mice entered the full anagen phase and mutant mice remained at the catagen and telogen phases (panels E and J), respectively. * indicates increased number of fat cells. Scale bars = 100 μm; (K) Statistical analysis indicated that relative thickness of mutant mice epidermis was significantly increased compared with the control group at all stage (P5–P32). n = 3 in each group, ** p < 0.01, *** p < 0.001.


