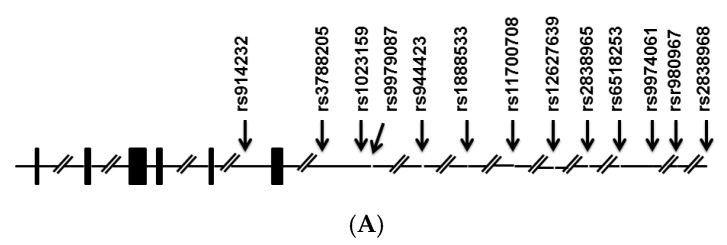
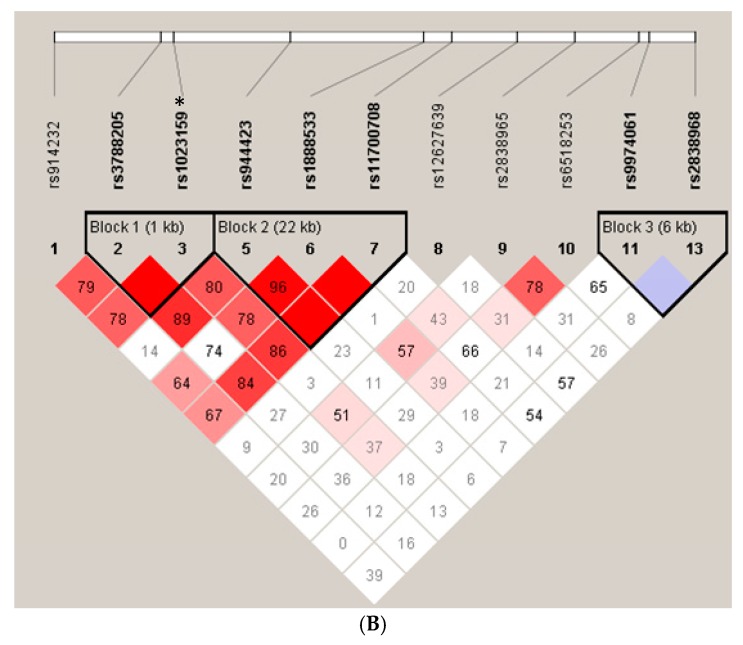
Figure 1.
The genomic structure of SLC19A1 (A). Bars, exons. Arrows, positions of single nucleotide polymorphisms (SNPs). Linkage disequilibrium plot of SNPs in the samples studied (B). Numbers in squares indicate D′ values. Reference Number (rs) with asterisk indicates the SNP with p < 0.05. The blocks are defined following the four-gamete rule [22]. Explanation of color scheme: If D′ < 1 and LOD (log of the likelihood odds ratio) <2, the cell color is white; if D′ = 1 and LOD < 2, the cell color is blue; if D′ < 1 and LOD ≥ 2, the cell color is shades of pink/red; if D′ = 1 and LOD ≥ 2, the cell color is bright red.


