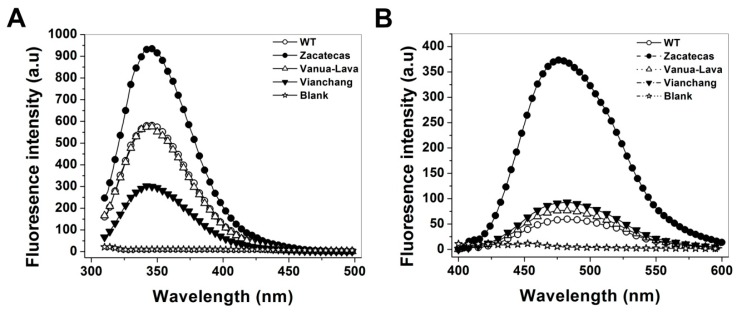
Figure 8.
Conformational changes in the tertiary structure of recombinant human WT G6PD enzymes and mutants. (A) Fluorescence emission spectra were performed in a Perkin-Elmer LS-55 fluorescence spectrometer. The assays were conducted with a protein concentration of 0.1 mg/mL; (B) ANS fluorescence spectra were obtained using an excitation wavelength of 395 nm and recording emission spectra from 400 to 600 nm. Values obtained from buffer containing ANS without protein (open stars) were subtracted from the recordings with protein. The experimental conditions for all the experiments are described in the Materials and Methods Section.

