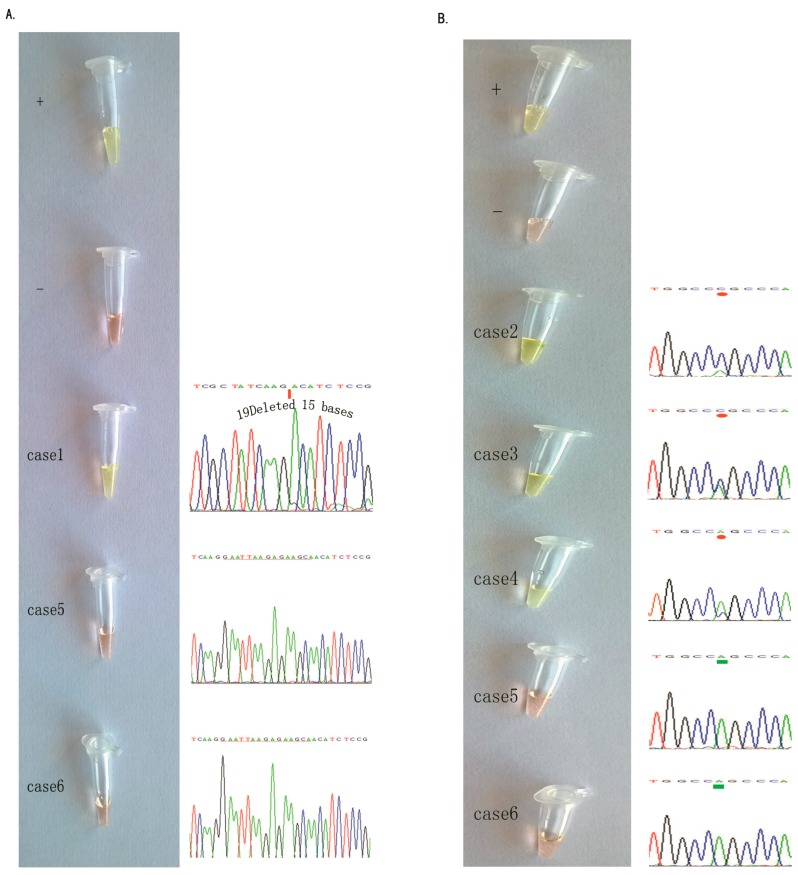
Figure 4.
Comparison of the PCR and DNA sequencing data with our visualization data using the ARPS method to detect the EGFR mutation in NSCLC tissue specimens. (A) EGFR 19Del(2) mutation. The left panel shows our data, and the right panel shows the DNA sequencing data. From top to bottom, the quality control of the positive sample, the quality control of the negative sample (HCC-827 and A549 cell lines), one positive clinical tissue sample, and two negative clinical tissue samples are shown; (B) The EGFR L858R mutation. The left panel shows our data, and the right panel shows the DNA sequencing data. From top to bottom, the quality control of the positive sample, the quality control of the negative sample (H-1975 and A549 cell lines), three positive clinical tissue samples, and two negative clinical tissue samples are shown. Results of ARPS were negative in red, positive in green.

