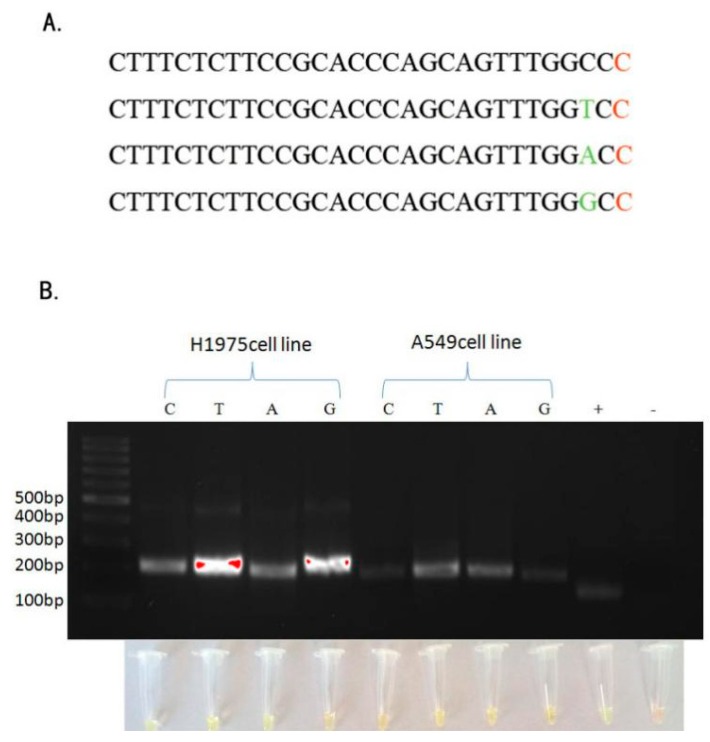
Figure 5.
Primer sequences and agarose gel electrophoresis data. (A) The position of another mismatch base in the reverse primer (green letters) to detect EGFR L858R; (mutant base in red letter) (B) The agarose gel electrophoresis and ARPS results of the different mismatch bases. The band size was 201 bp, and the “+” indicates the positive control from the RPA reaction kit (143 bp). The amount of DNA used was 300 ng.

