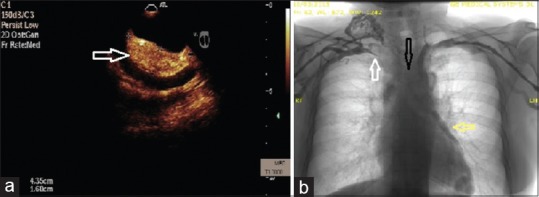
Figure 2.

(a) Transesophageal echocardiography, interatrial septal fatty infiltration was demonstrated (arrow). Interatrial septum of 1.6 cm thick (b) beside subtraction venography shows: On the right, progressive stenosis of the right anonymous vein and finally stop before the superior vena cava origin (white arrow) with multiple venous collateral vessels formation. On the left, there is a stop at the distal part of left anonymous vein (black arrow) and presence of enlarged varicose veins at the level of the left heart margin area (yellow arrow)
