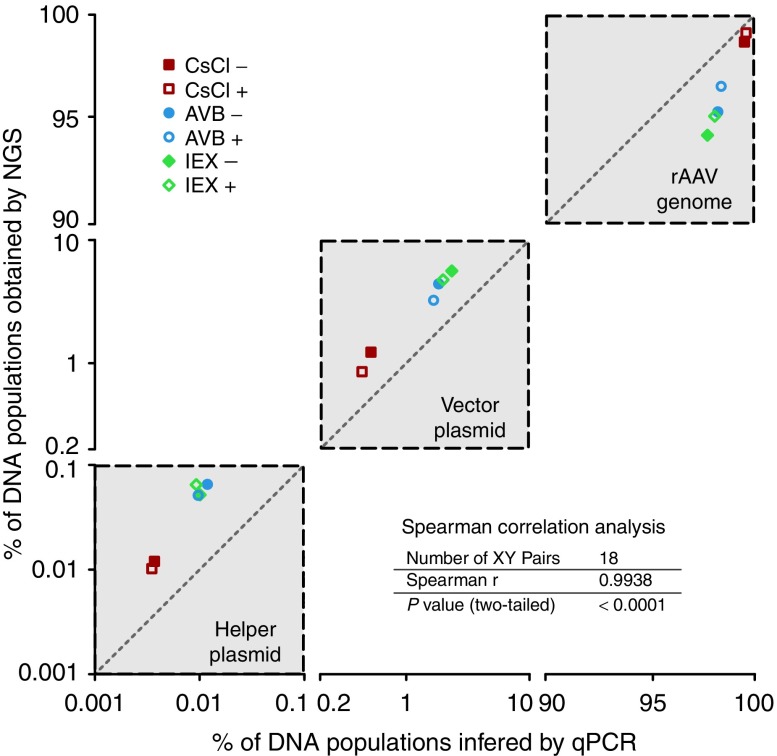
Figure 2.
Correlation of the percentages of DNA populations in rAAV preparations obtained by next-generation sequencing (NGS) and inferred from quantitative polymerase chain reaction (qPCR) data. The data obtained for the three references (rAAV genome, backbone of the vector plasmid, and helper plasmid) detected in both NGS and qPCR are clustered in gray squares crossed by diagonal lines, indicating the perfect correlation between the two methods. The x- and y-axes are symmetrical, represented on log scales and truncated between 0.1–0.2 and 10–90 to highlight the intersample variability. Each point corresponds to the average percentage of two technical replicates for both NGS and qPCR. The correlation between the methods was evaluated with the nonparametric Spearman's test because of the small sample size (18 pairs) and the absence of information about the distribution of the measured variables (Spearman's correlation coefficient, two-tailed P value, 95% confidence interval).

