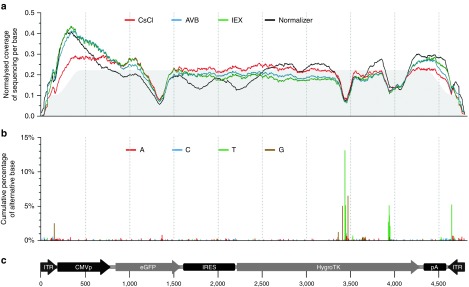
Figure 4.
Sequencing coverage and percentage of single nucleotide variants along the rAAV genome. (a) Sequencing coverage along each base of the rAAV CMVp-eGFP-hygroTK-bGHpA genome. To compare samples independently of their sequencing depth, a normalized depth of coverage was computed by counting the number of reads aligned to each base (×1,000), divided by the sum of coverage for all bases mapped along the rAAV genome. Lines correspond to the average normalized coverage of the two technical replicates for the rAAV preparations, purified by CsCl (red), IEX (green), AVB (blue), and the internal normalizer control (black), without DNase treatment. The gray area below the graph represents the normalized coverage of the in silico-generated control. The shoulders at the extremities correspond to the range of artificial fragmentation specified in the program that generates the artificial Fastq datasets (250–450 bases). (b) Cumulative percentage of alternative base A (red), C (blue), T (green), and G (brown) compared with the reference sequence, i.e., single-nucleotide variants. When several variants were found at the same nucleotide position, variant contributions were stacked. SNVs are represented on the graph if they were found in at least half of all of the experimental samples. (c) Map and length of the rAAV genome, represented to scale below the graphs, with coordinates in base pairs. CMVp, cytomegalovirus promoter; eGFP, enhanced green fluorescent protein CDS; HygroTK, hygromycin-thymidine kinase fusion CDS; IRES, internal ribosome entry site; ITR, inverted terminal repeat; pA, bovine growth hormone polyadenylation signal.

