Figure 2.
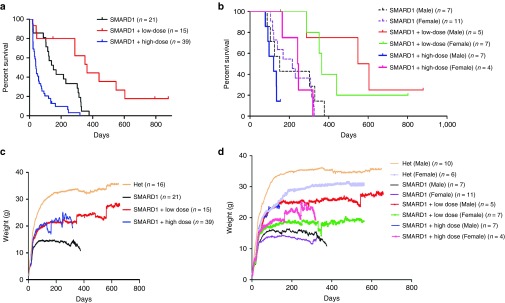
Intracerebroventricular (ICV) injection of AAV9-IGHMBP2 in low dose significantly increases the survival and total body weight in males and females nmd. (a) Homozygous nmd mice were injected ICV at P2 and P3 with 1.25 × 10¹¹ and at P2, P3, and P4 with 2.5 × 10¹¹ genomic copies of AAV9-IGHMBP2 and compared to untreated. Survival was determined by Kaplan-Meier curves and P value was determined by the log-rank (Mantel-Cox) test. Median survival of low-dose-injected nmd mice (n = 15) was 364 days compared to 151 days in untreated nmd (n = 21) (P = 0.001); median survival of high-dose-injected nmd (n = 39) was 41 days compared to 151 days in untreated (P = 0.0001) and 364 days in low-dose treated (P < 0.0001). (b) Survival of low- and high-dose-treated nmd based on their gender. The median survival of low-dose-injected nmd females (n = 7) was 364 days compared to 215 days in untreated female (n = 11) (P = 0.002); median survival of high-dose-treated nmd females (n = 4) was 244 days compared to 215 days in untreated females (P = 0.94). The median survival of low-dose-injected nmd males (n = 5) was 576 days compared to 151 days in untreated males (n = 7) (P = 0.01); median survival of high-dose-treated nmd males (n = 7) was 120 compared to 151 days in untreated males (P = 0.21) and 576 days in low-dose-treated males (P = 0.006). (c) Weight assessment of low- and high-dose-treated nmd compared to untreated and “Het”. The weight of low-dose-treated nmd is 21.96 ± 0.17 g and high-dose treated 19.46 ± 0.27 g compared to 13.17 ± 0.12 g in untreated (one-way ANOVA P < 0.0001). (d) Weight assessment of low- and high-dose-treated nmd based on their gender. The weight of low-dose-treated nmd females (n = 7) is 17.51 ± 0.128 g and high-dose-treated females (n = 4) 19.16 ± 0.26 compared to 12.57 ± 0.136 g in untreated females (n = 11) (one-way ANOVA P < 0.0001). The weight of low-dose-treated nmd males (n = 5) is 24.25 ± 0.18 and high-dose-treated males (n = 7) 18.29 ± 0.57 g compared to 14.12 ± 0.14 g in untreated males (n = 7) (one-way ANOVA P < 0.0001). Graphs “a” and “c” include all the untreated and treated animals and graphs “b” and “d” are based on gender differences and only represent males and females that reached adulthood excluding the mice that either died early or developed hydrocephalus.

