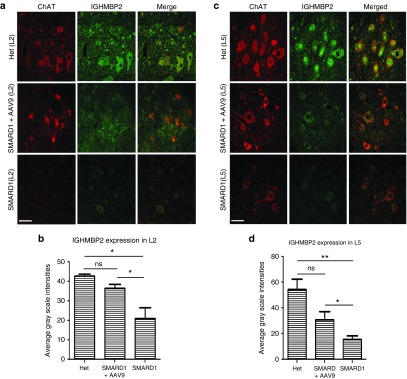
Figure 7.
AAV9-IGHMBP2 treatment increases the level of IGHMBP2 expression in motor neurons of L2 and L5 sections of spinal cord. (a,c) Representative confocal fluorescent images of L2 (a) and L5 (c) spinal cord of low-dose-treated males at 8 weeks of age stained with ChAT (red) and IGHMBP2 (green) demonstrates the IGHMBP2 expression in ChAT-positive motor neurons and is compared to age-matched untreated and “Het” sections. The level of transduction is represented by gray scale intensities only in Chat-positive motor neurons relative to “Het”. Scale bar = 50 µm. (b,d) Quantification of IGHMBP2 expression level in ChAT-positive motor neurons of treated males shows that IGHMBP2 levels is increased significantly in L2 (b) and L5 (d) compared to untreated (one-way analysis of variance treated versus untreated P = 0.03 in L2; P = 0.01 in L5). Error bars represent mean ± standard error of the mean.

