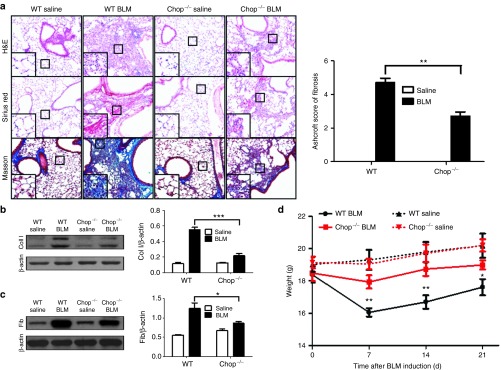
Figure 2.
Comparison of the severity of lung fibrosis between Chop−/− and WT mice 21 days after BLM induction. (a) Histological analysis for the severity of lung fibrosis in mice after BLM induction. Left panel: representative results for H&E (Top), Sirius red (center), and Masson staining (bottom). The inset shows higher magnification for a particular location. Right panel: a bar graph showing the semiquantitative Ashcroft scores for the severity of fibrosis. Images were taken under original magnification ×200. b, c Western blot analysis of fibrotic markers collagen I (b) and fibronectin (c). Left panel: a representative western blot result. Right panel: a bar graph showing the mean data of all mice analyzed in each group. (d) Body weight change during the course of BLM-induced fibrosis. Each bar represents mean ± SEM of 12 mice analyzed. *P < 0.05; **P < 0.01; ***P < 0.001. BLM, bleomycin; Coll, collagen I; Fib, fibronectin; WT, wild type.

