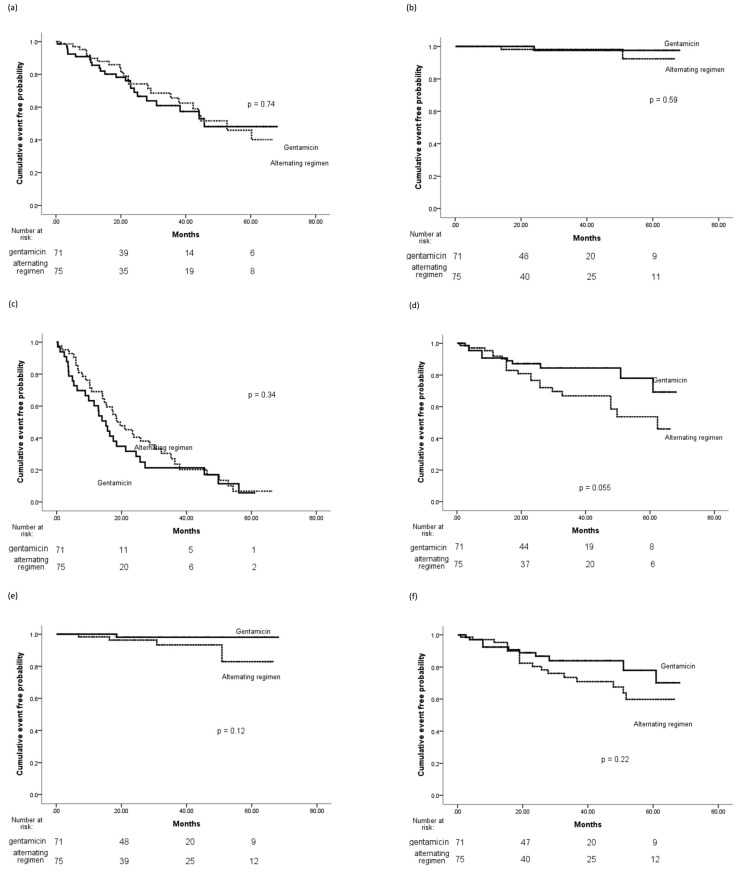
Figure 2 —
Kaplan-Meier plots of primary and secondary endpoints. (a) Time to first ESI. (b) Time to first NTM ESI. (c) Time to first peritonitis. (d) Time to first gram-negative peritonitis. (e) Time to first fungal peritonitis. (f) Time to infection-related catheter removal or death. ESI = exit-site infection; NTM = non-tuberculous mycobacteria.

