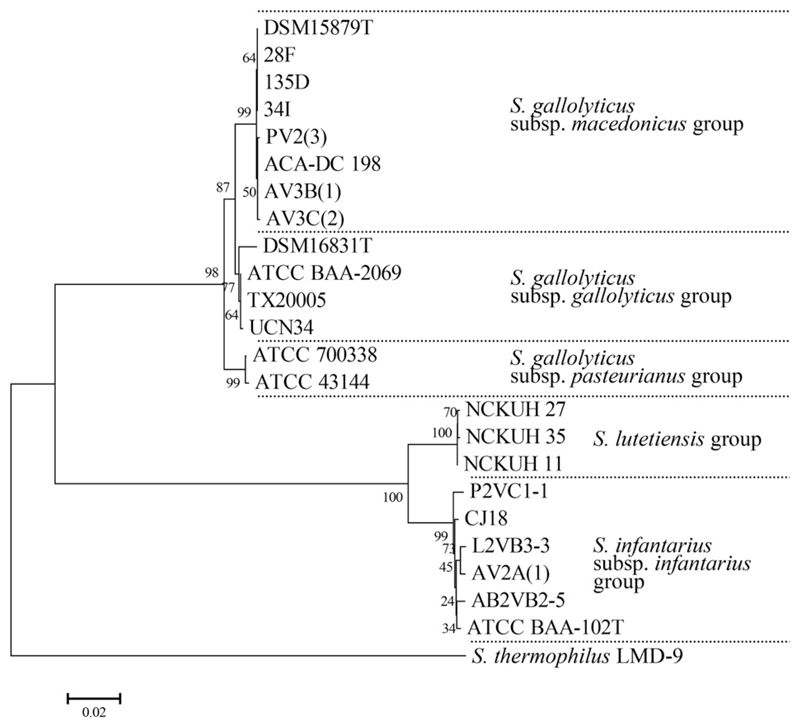
Fig. 2.
Phylogenetic neighbor-joining tree of aligned and trimmed partial groES and groEL gene sequences (1402–1441 bp) of S. gallolyticus subsp. macedonicus and Sii strains in comparison with reference strains and S. thermophilus LMD-9 as out-group. The optimal tree with the sum of branch length = 0.47843285 is shown. The percentage of replicate trees in which the associated taxa clustered together in the bootstrap test (1000 replicates) is shown next to the branches. The tree is drawn to scale, with branch lengths in the same units as those of the evolutionary distances used to infer the phylogenetic tree. The evolutionary distances indicated by the horizontal bar below the figure are in the units of the number of base substitutions per site. All positions containing gaps and missing data were eliminated from the dataset (complete deletion option). There were a total of 1369 positions in the final dataset.

