
Figure 3.
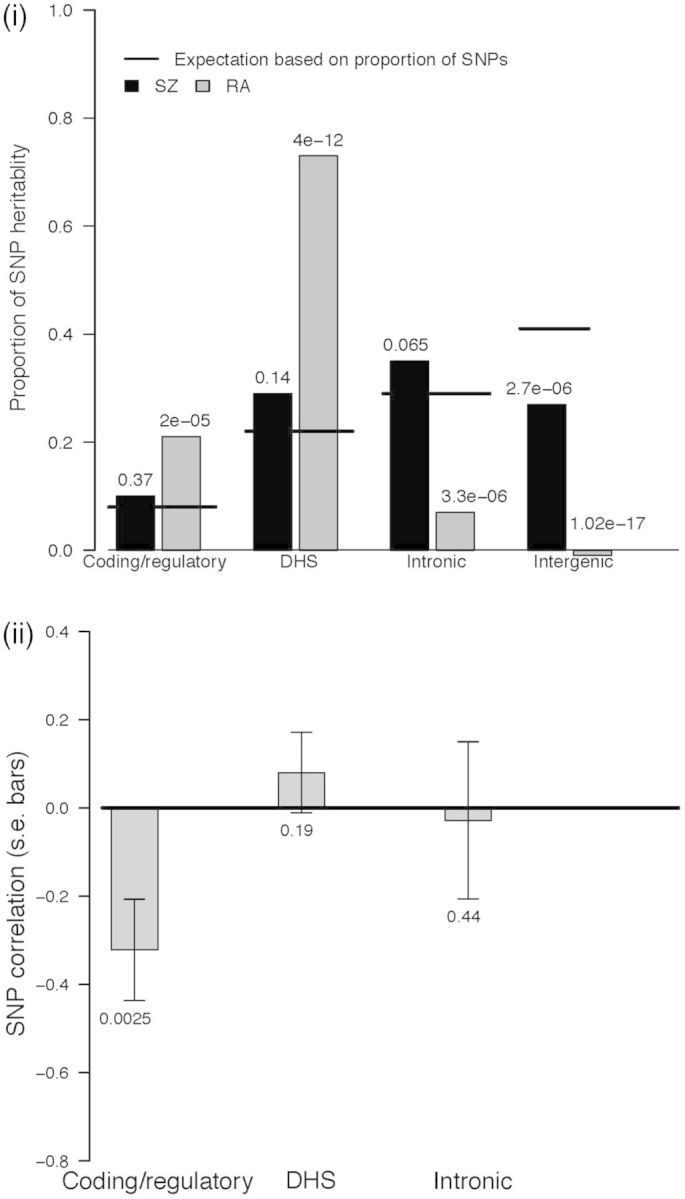
Genomic partitioning analyses; (i) Percentage of SNP heritability attributed to each functional annotation class for SZ and RA, compared with the percentage of SNPs attributed to each class. Adjacent to the bars are the P-values for H0: percentage of variation attributed to annotation class = percentage of SNPs attributed to the annotation class; (ii) SNP correlation between SZ and RA based on annotation. Estimates are from analyses using as the phenotype residuals after adjusting SNPs in the MHC region. When the MHC is included, the coding/regulatory correlation is −0.174, s.e. 0.071, P = 0.0075.