
Figure 3.
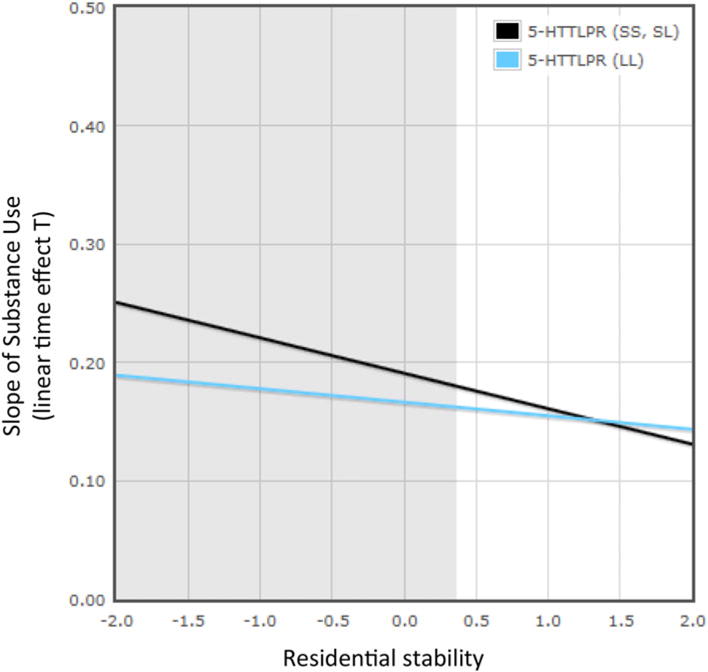
(Color online) The effects of neighborhood residential stability (range = <2 SD to >2 SD from mean) on the predicted growth parameter of substance use by 5-HTTLPR, and the effects of neighborhood residential stability (range <2 SD to >2 SD from mean) on the predicted growth parameter of substance use by 5-HTTLPR using a multilevel growth model. The lines represent the regression lines for short–short (SS) and short–long (SL) allele carriers (simple slope test: b = –0.03, p = .000) and long (LL) allele carriers (simple slope test: b = –0.01, p = .021). The gray areas are significant confidence regions (≤0.365). The proportion of the interaction is .04.