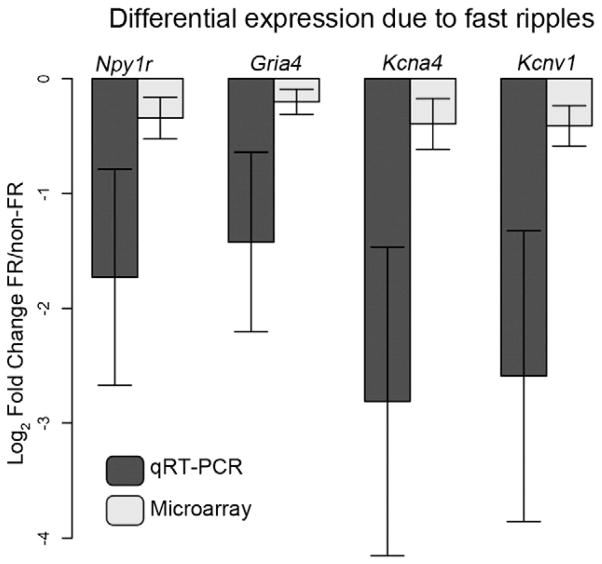
Fig. 2.
Differential expression between FR and non-FR samples. To confirm gene expression changes observed in the microarray experiment, we performed quantitative PCR on four genes, Gria4, Npy1r, Kcna4, and Kcnv1. The barplot demonstrates the average fold change between the FR and non-FR samples from the same slice across all eleven slices. Fold changes were also calculated from the microarray data, and these values are shown as a comparison. Each of these genes demonstrates significantly decreased expression within the FR samples as compared to the non-FR samples (P < 0.05). Each sample was evaluated with four replicates, and Gapdh was used as the loading control for quantitative PCR. Significance was determined using a paired t-test (n = 11), and error bars represent the standard error.

