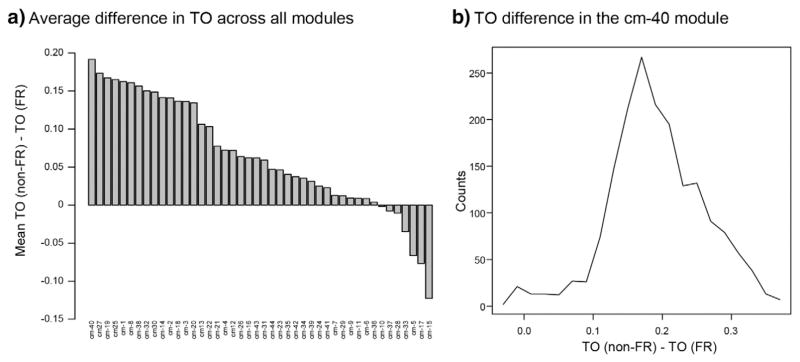
Fig. 4.
Comparison of co-expression measured by TO between the FR and non-FR datasets for each module in the consensus network. a) The barplot demonstrates the average difference in TO between non-FR and FR datasets within each consensus module. Genes with a kME > 0.7 in either the non-FR or FR network were selected for each module, and TO between all genes within a module was calculated separately between the non-FR and FR datasets. The y-axis displays the average difference in TO between the non-FR and FR datasets across all genes in a module. There is a notable skew towards higher connectivity in the non-FR dataset in multiple consensus modules, but the cm-40 module displays the largest average difference. b) The histogram shows the TO difference between the non-FR and FR datasets across all genes within the cm-40 module. The x-axis represents the difference in TO between the non-FR and FR datasets for each gene, and the y-axis represents the number of genes with the specific value of difference in TO. There is a dramatic shift towards higher TO values in the non-FR dataset, demonstrating stronger co-regulation of the genes within the cm-40 module in non-FR areas.

