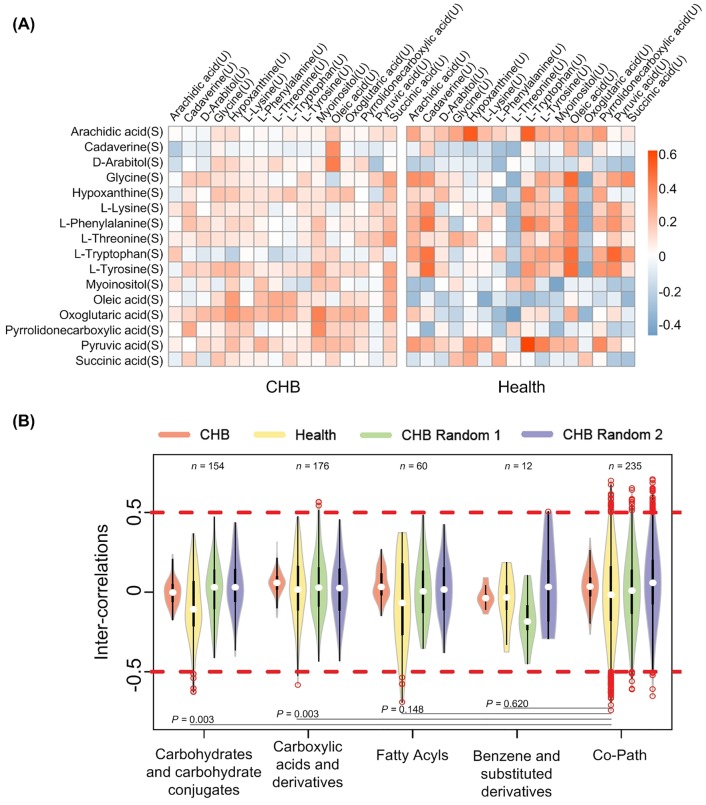
Fig 1. Inter-correlations between serumal and urinary metabolites.
(A) Correlation between overlapped metabolites of serum and urine. “U” means compound in urine and “S” means metabolites in serum. Each lattice denotes correlation within one metabolite pair. (B) Distribution of inter-covariations between metabolites within the same category or pathway. Categories were identified based on the chemical taxonomy in HMDB [15]; only categories possessing more than 10 inter-covariations were displayed; the number of inter-covariations possessed by each category was shown in the top region; among the categories, differences of covariations’ distribution were calculated based on healthy group in form of P-values (Kolmogorov-Smirnov test); CHB random 1 and 2 are two CHB random sets with the same sample number as healthy controls.

