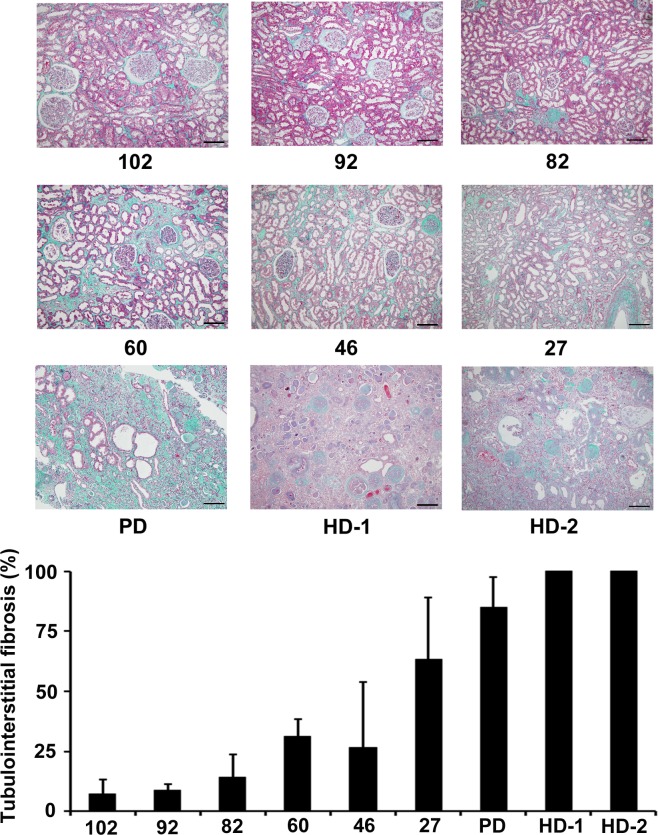
Fig 1. Tubulointerstitial damage of the patients with all the range of renal function.
Masson’s trichrome staining was performed for histopathological evaluation of tubulointerstitial damage. Numbers below each figure mean estimated glomerular filtration rate of each patient. Original magnification ×100. The scale bar in each figure represents 100 μm. Patients who were representative for the stages of chronic kidney disease were selected at random. The graph indicates the percentages of tubulointerstitial fibrosis that were evaluated in microscopic fields observed at ×100 magnification. Ten microscopic fields were evaluated for each patient using a point-counting method, and mean values were calculated. Abbreviations: PD, peritoneal dialysis; HD, hemodialysis.

