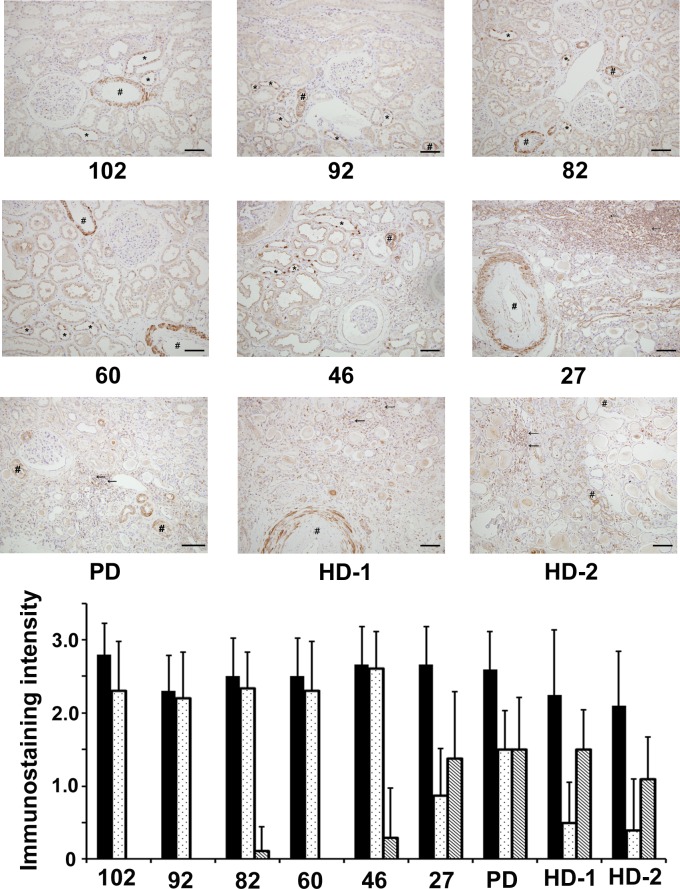
Fig 2. Immunostaining for (pro)renin receptor [(P)RR].
Ten small vessels and collecting ducts or connecting tubular cells and infiltrated cells in 10 microscopic fields at ×100 magnification were evaluated for representative samples according to the stained levels for (P)RR: unstained, 0; weak, 1; moderate, 2; and severe, 3; and mean values were calculated. There were no significant differences among patients in the levels of immunostaining in the small vessels. The levels of immunostaining in the collecting ducts or connecting tubular cells for the patients who had worse renal function were weaker than those who had better renal function. On the other hand, more infiltrated cells for (P)RR positive were found for patients who had the worse renal function, compared with those who had better renal function. Sharps (#), asterisks (*), and arrows (←) indicate the vessels, the collecting ducts or connecting tubule, and infiltrating cells positive for (P)RR, respectively. Numbers below each figure mean estimated glomerular filtration rate of each patient. Original magnification ×200. The scale bar in each figure represents 100 μm. The same patients in whom Masson’s trichrome staining were performed were selected. Black, dotted, and diagonal bars indicate the immunostaining intensity levels of small vessels, collecting ducts or connecting tubular cells, and infiltrated cells, respectively. Abbreviations: PD, peritoneal dialysis; HD, hemodialysis

