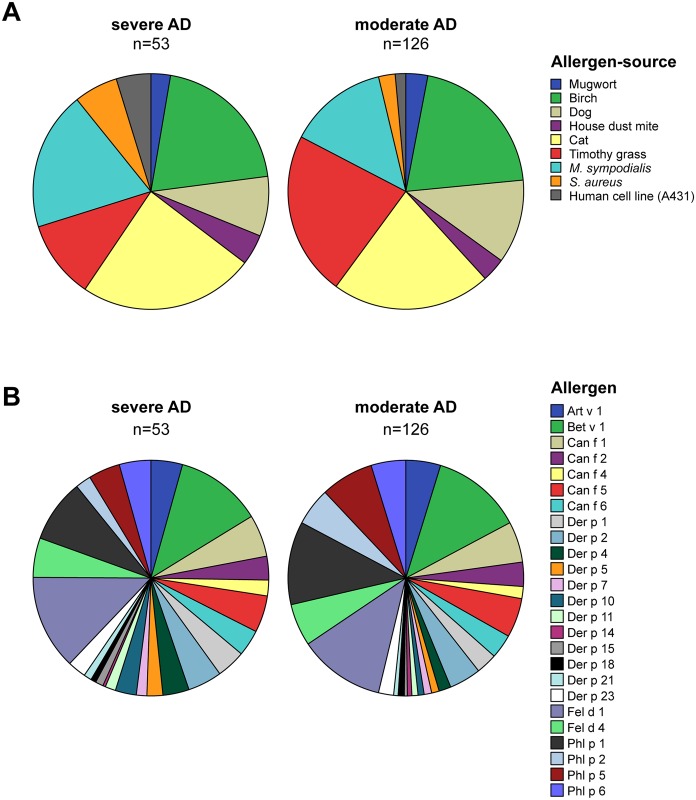
Fig 1. Pie charts showing the contribution of (A), allergen sources and (B), individual allergen components to IgE sensitization.
Each chart represents 100% of IgE reactivities detected in plasma from all AD patients of the respective group, severe AD (left chart) and moderate AD (right chart), in (A) to six allergen sources using the MeDALL allergen-chip (ISU ≥ 0.3) and to extracts of M. sympodialis, S. aureus and the human cell line A431 using immunoblotting, and in (B) to 25 allergen molecules using the MeDALL allergen-chip (ISU ≥ 0.3). The sizes of the segments represent the proportion of the respective in (A), allergen source and in (B), allergen molecule among all recognized. Allergen sources/molecules start a 12 o’clock of the pie chart and continue clock-wise as listed with the color code.

