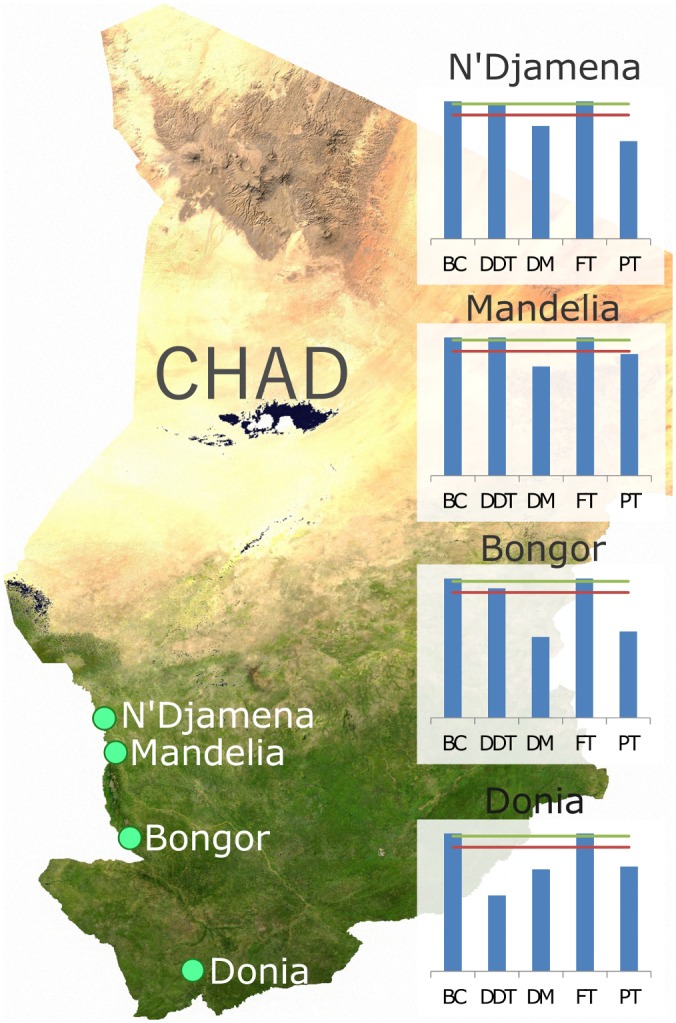
Fig 1. Sentinel sites for biannual resistance monitoring.

Green dots indicate the geographic locations of each of the four sites. Sites were chosen to represent a range of different selection pressures for insecticide resistance. Embedded charts show the baseline percentage mortality for the year in which monitoring began (2008), where BC = bendiocarb, DDT = DDT, DM = deltamethrin, FT = Fenitrothion, and PT = Permethrin. Green lines represent 98% mortality and red lines indicate 90% mortality. Map source https://commons.wikimedia.org/wiki/File:Chad_sat.jpg.
