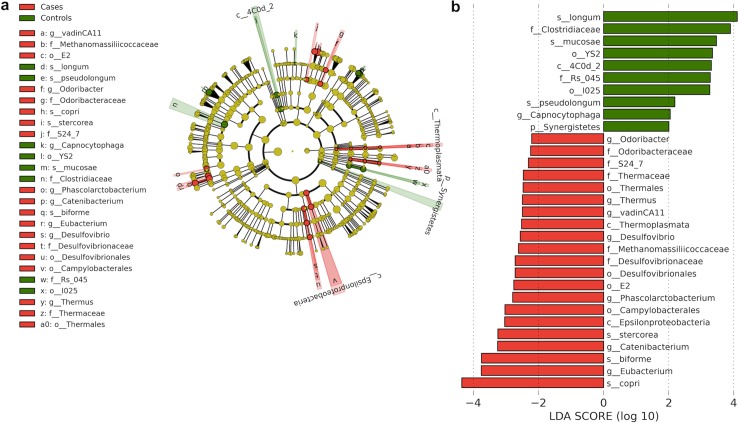
Fig 4. Differentially abundant taxa between cases and controls.
a: Linear Discriminant Analysis Effect Size (LEfSe) cladogram of differentially abundant taxa in cases and controls [phylum (p), class (c), order (o), family (f), genera (g), species (s)]. b: Linear Discriminant Analysis (LDA) scores of differentially abundant taxa in cases and controls. The LDA score indicates the effect size and ranking of each differentially abundant taxon.

