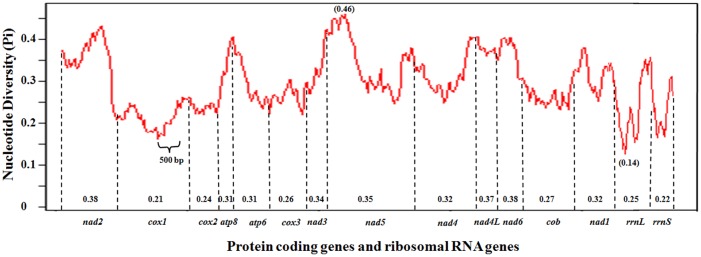
Fig 5. Sliding window analyses of protein coding genes and ribosomal RNA genes among Psylloidea mitogenomes.
The graph shows the change of nucleotide diversity (Pi) in a sliding window of 250 bp with the step size of 25 bp. The average of Pi values of each gene are presented at the bottom calculated using DnaSP v5 [33] software. Note the location of the 500-bp region in cox1 that was used for Bactericera cockerelli haplotyping.

