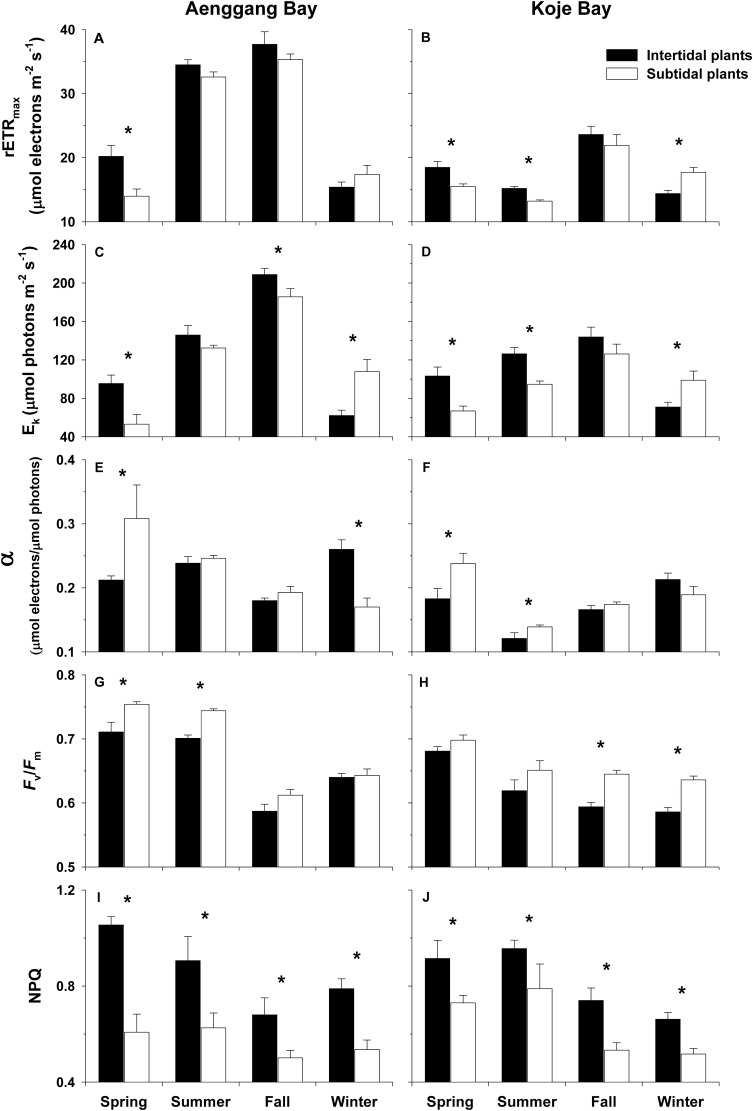
Fig 3. Zostera marina.
Parameters (rETRmax, α, Ek, Fv/Fm, and NPQ) derived from the rapid light curves (RLC) of intertidal and subtidal plants in Aenggang Bay (A, C, E, G, and I) and Koje Bay (B, D, F, H, and J). Stern–Volmer non-photochemical quenching (NPQ) values were obtained at the highest actinic irradiance. Values are means ± standard errors (n = 10–15). An asterisk above the bar indicates a significant difference between the intertidal and subtidal plants in each season.

