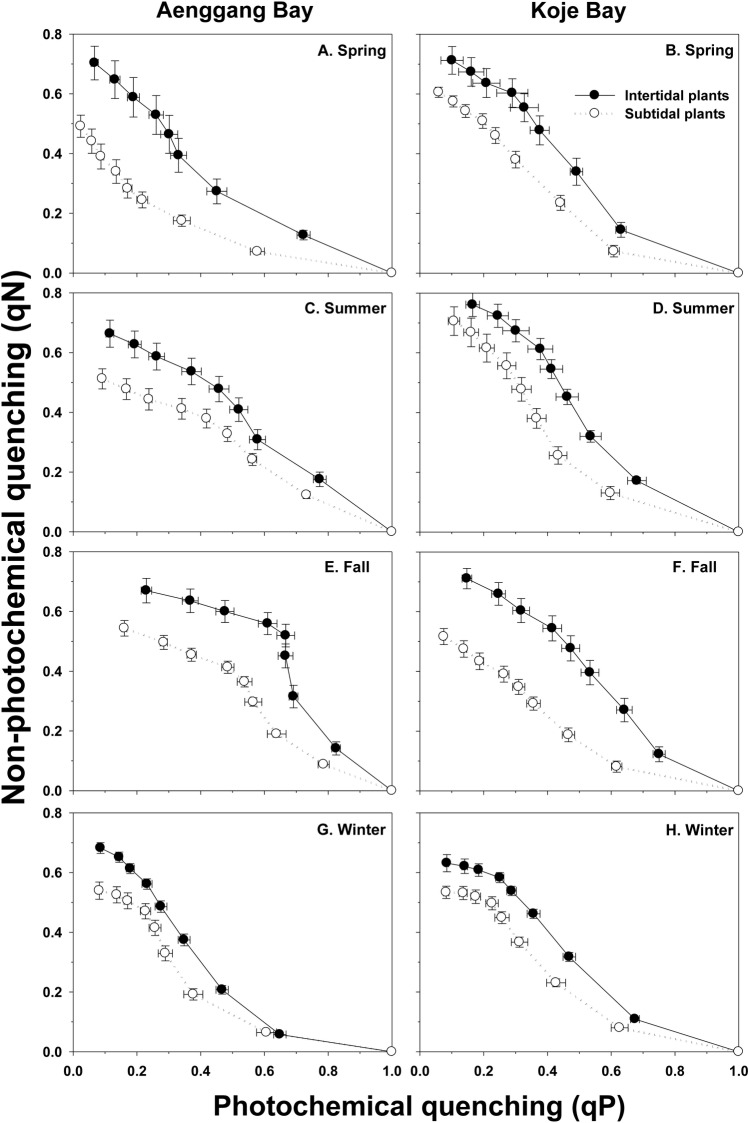
Fig 4. Zostera marina.
Relationship between photochemical quenching (qP) and non-photochemical quenching (qN) during each season in Aenggang Bay (A, C, E, and G) and Koje Bay (B, D, F, and H). The rapid light curve (RLC) measurements were taken from the lowest to highest actinic light levels and are displayed from right to left on the x-axis. Values are means ± standard errors (n = 10–15).

