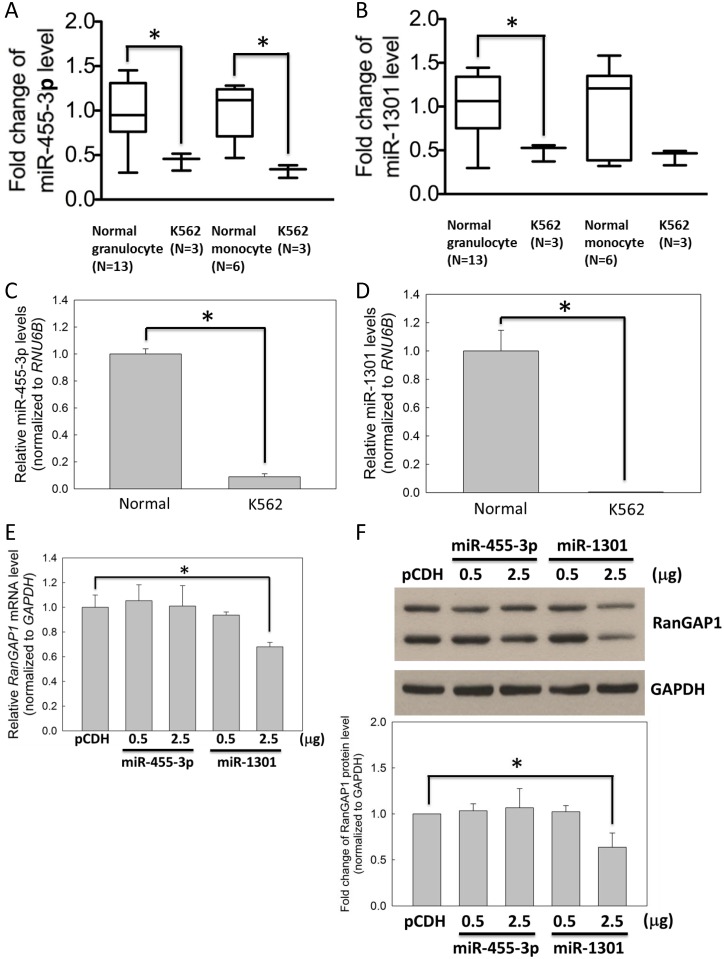
Fig 4. Expression level of miR-1301 was lower in CML cells compared with that in normal cells.
The mRNA expression levels of miR-455-3p (A) and miR-1301 (B) in K562 cells compared with those in normal monocytes and granulocytes from healthy volunteers were measured using microarrays from the GEO database (accession number GSE51908). In addition, the expression levels of miR-455-3p (C) and miR-1301 (D) in K562 cells were measured through qRT-PCR relative to those in normal monocytes. K562 cells were transfected with pCDH (vector only), miR-455-3p, or miR-1301 plasmids for 48 h and subsequently subjected to qRT-PCR (E) and immunoblot assays (F) for assessing the RanGAP1 level. (F) The bar graph indicates quantitative data on the RanGAP1 protein level. GAPDH was used as an internal control. Results are presented as means + SD of three independent experiments. *p < 0.05, compared with the control.

