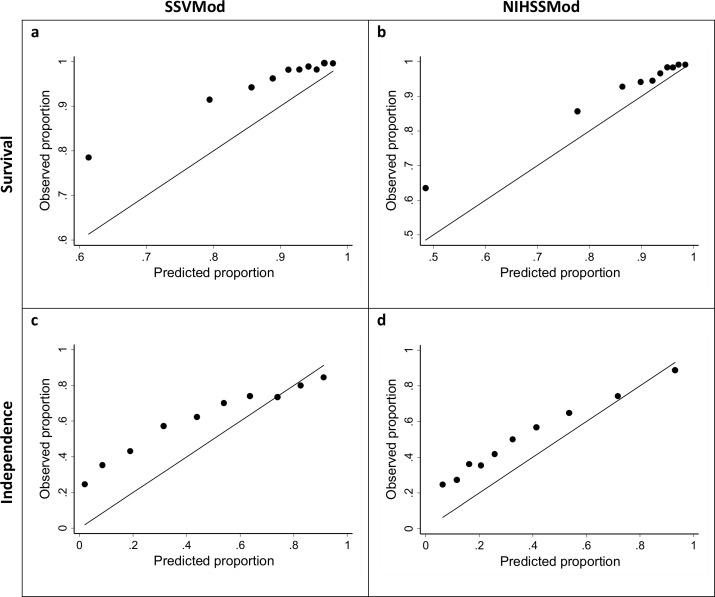
Fig 2. Calibration plots for survival and independence, for the total sample and based on deciles of patient numbers.
Survival: assessed at 30 days for the SSVMod and at 100 days for the NIHSSMod. Independence: assessed at 6 months for the SSVMod and at 3 months for the NIHSSMod. For illustrative clarity, the origins for the axes vary between plots.

