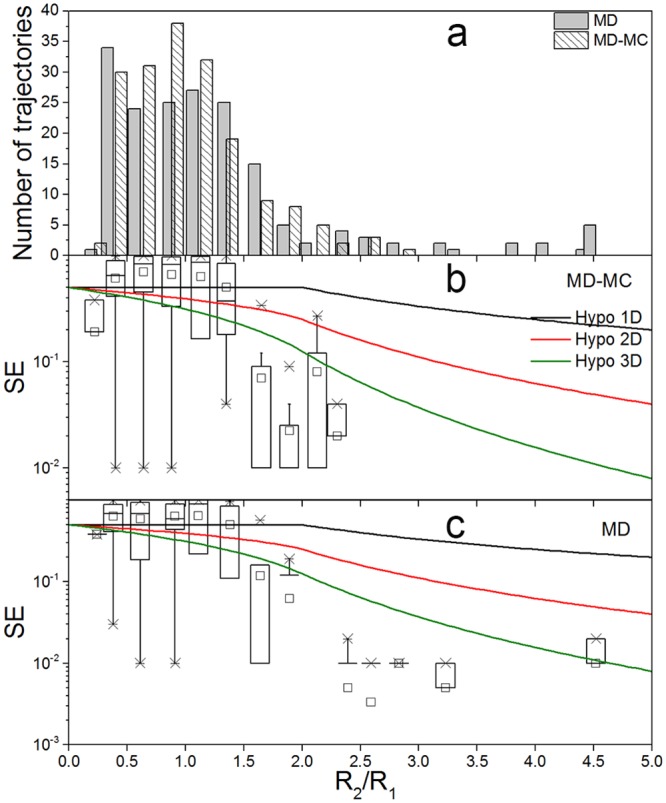
Fig 6. The distribution of trajectories and their SE against R2/R1.

Trajectories from the backward MD-MC simulations and the parallel MD simulations (a); the SE for the MD-MC simulations (b) and the parallel MD simulations (c). The lines present the hypothetical SE curves in 1-D, 2-D and 3-D. The boxplots represent the distribution of the actual SE in each bin.
