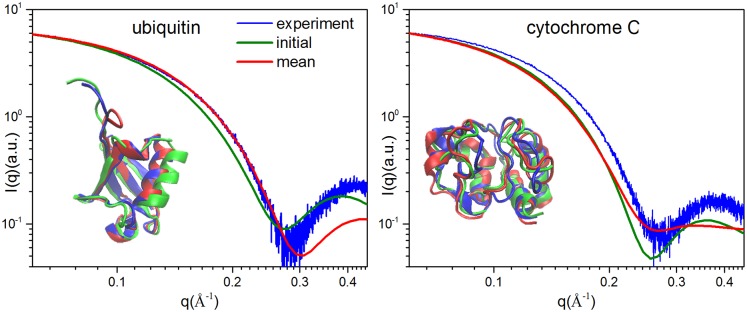
Fig 9. Structural and SAXS profiles comparison among initial (green), target (blue) and simulation (red) structures for ubiquitin and cytochrome C using experimental target SAXS profiles.
The calculated SAXS profiles are the average of all 1,250 conformations in the last 5 ns of hybrid MD-MC simulations.

