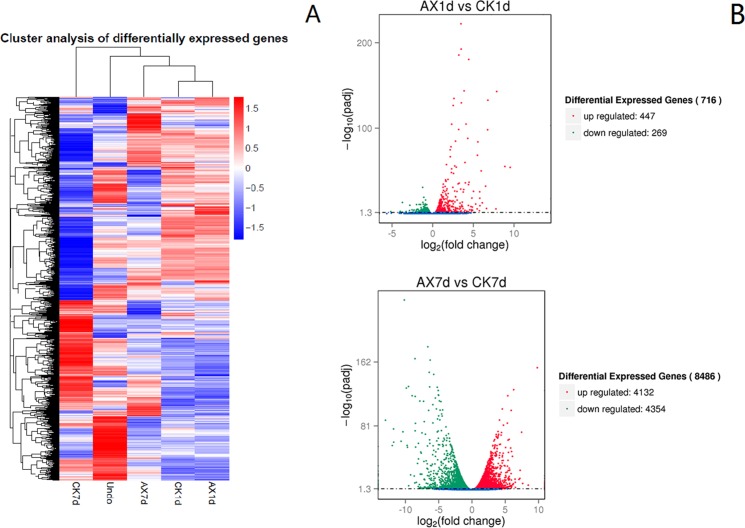
Fig 2. Differentially expressed genes in the samples.
(A) Hierarchical clustering and heat map of differentially expressed genes based on the expression levels (RPKM). Genes in red and blue represent highly and lowly expressed genes, respectively. (B) The volcano plot shows the numbers of significantly differentially expressed genes in each comparison group.

