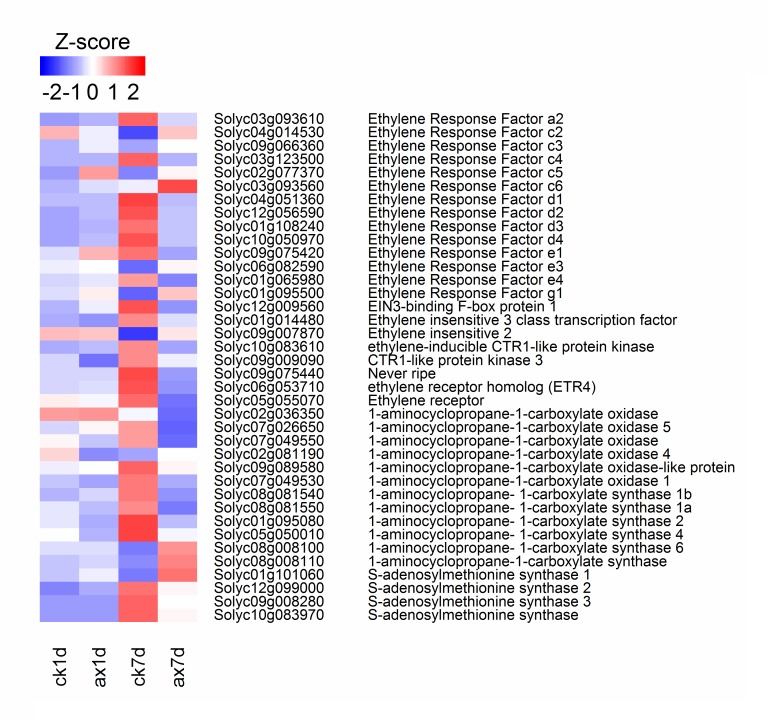
Fig 5. Heat map of the expression levels of the DEGs involved in ethylene synthesis and signal transduction.
The RPKM values were normalized with log2 (RPKM+1) and converted to Z-scores to scale the expression levels of DEGs involved in ethylene synthesis and signal transduction. Red indicates high expression, while blue denotes low expression.

