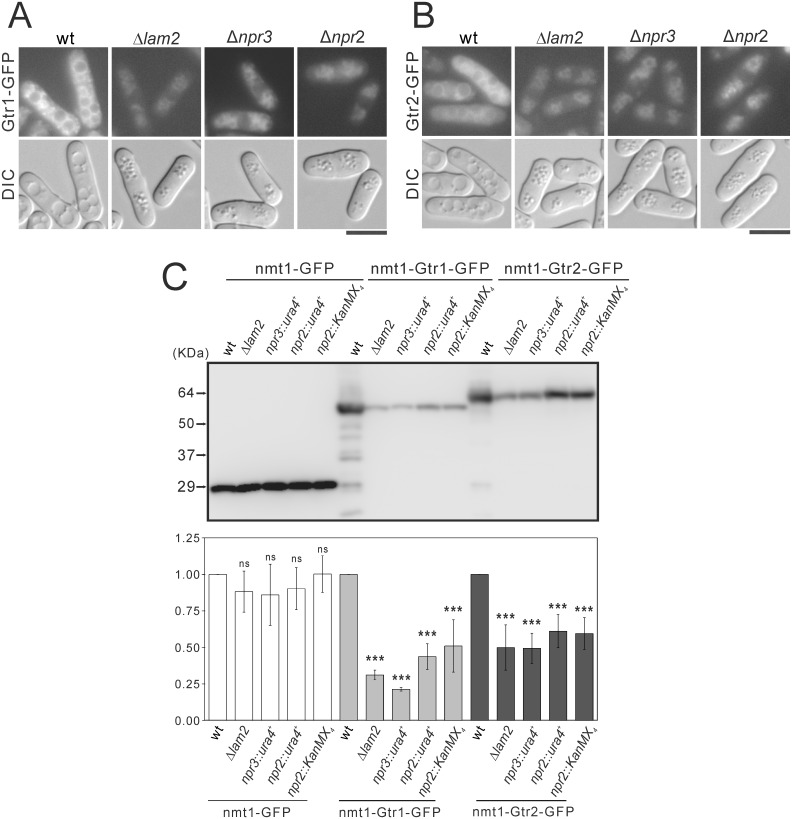
Fig 8. Lam2, Npr3 and Npr2 are necessary for maintaining the vacuolar localization and the protein levels of Gtr1 and Gtr2.
(A, B) Intracellular localization of Gtr1-GFP (A) or Gtr2-GFP (B) in wild-type (wt) cells, Δlam2 cells, Δnpr3 cells or Δnpr2 cells are shown. The leucine auxotrophic wild-type (wt, HM123), Δlam2 cells (KP6607), Δnpr3 cells (KP6551) and Δnpr2 cells (KP6586) transformed with the plasmids expressing Gtr1-GFP (pKB8702) (A) or Gtr2-GFP (pKB9133) (B) under nmt1 promoter were grown to early log phase in EMM medium at 27°C, and then were shifted to YES medium overnight. The fluorescent and DIC images were then acquired after the cells were treated with distilled water for 30 min. Scale bar, 10 μm. (C) The protein levels of Gtr1-GFP and Gtr2-GFP in wild-type (wt) cells, Δlam2 cells, Δnpr3 cells and Δnpr2 cells. The leucine auxotrophic wild-type (wt, HM123), Δlam2 cells (KP6607), npr3::ura4+ cells (KP6551), npr2::ura4+ cells (KP6586) and npr2::KanMX4 cells (KP6585) transformed the plasmids expressing, GFP (pKB2728), Gtr1-GFP (pKB8702) or Gtr2-GFP (pKB9133) under nmt1 promoter were grown to early log phase in EMM medium without thiamine at 27°C for 20 h. Proteins were extracted and subjected to SDS-PAGE and immunoblot analyses with anti-GFP antibodies. A representative image of immunoblot analysis is shown in the upper panel. Signal intensities of the corresponding bands were quantified and normalized to the values of wild-type cells. The resultant normalized intensities were averaged across three independent blots, and are shown in the lower panel. ***P<0.001 for Turkey’s test following one-way ANOVA for the comparisons with the value of wild-type cells.

