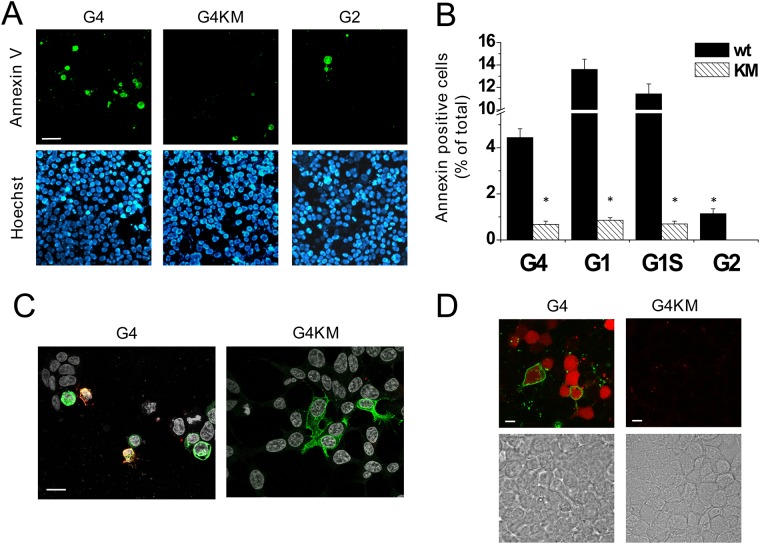
Fig 5. ABCG4 induces apoptosis.
(A) HEK293 cells were transfected with wild type (wt) ABCG4 or its inactive mutant (G4 or G4KM, respectively). ABCG2-expressing cells served as a negative control (G2). Apoptotic cells in cultures were visualized by fluorescently labeled Annexin V (green). Lower panels depict Hoechst 33342 nuclear staining (blue) in the same fields of view. Similar experiments with the ABCG1 isoforms and their inactive mutant variants are shown in S3 Fig. (B) The quantitative results are expressed as the percentage of apoptotic cells of total cells. The mean values ± S.E.M. obtained from at least 3 independent transfections are shown. The fraction of apoptotic cells was significantly larger in cultures transfected with the wt ABCG4 or ABCG1 than in cultures expressing the inactive mutants (KM), or the wild type ABCG2. Asterisks indicate significant differences as compared to wild type expressing cells (p < 0.01). (C) Co-staining of ABCG4 expression (green) and Annexin V binding (red) in cultures transfected with wt G4 or G4KM demonstrates the connection between the functional expression of ABCG4 and apoptosis. (D) Parallel detection of Annexin V binding (green) and caspase-3 activity (red) in cell cultures transfected with wt or inactive mutant ABCG4 confirmed that the functional ABCG4-induced apoptosis. DIC images on the lower panels demonstrate the presence of cell in the same fields of view.

