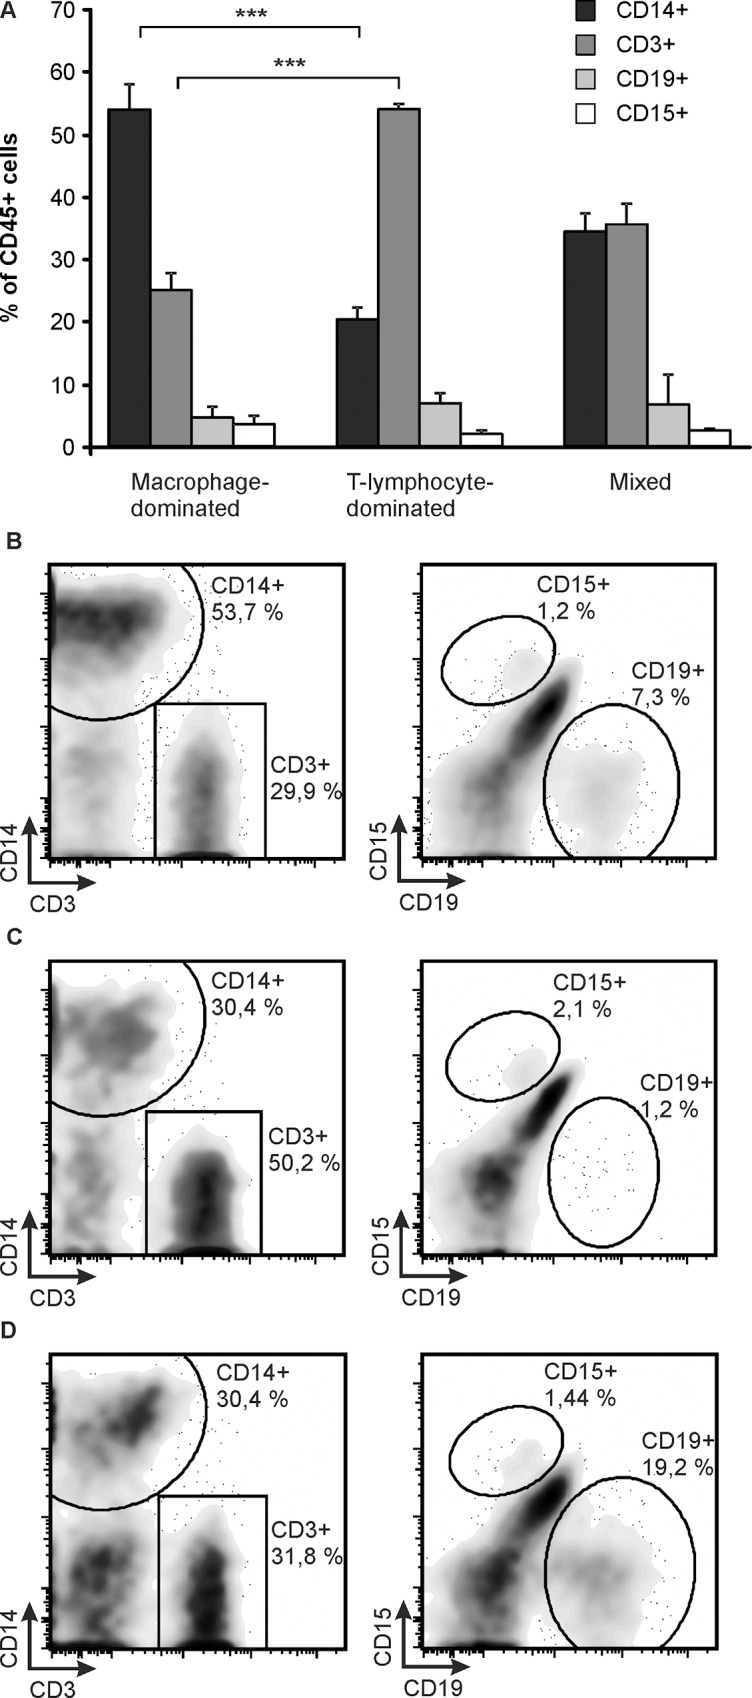
Fig 1. Flow Cytometry Analysis of CD45+ Cells Derived from Pseudotumor Tissue.

CD45+ cells were gated and proportions of CD14+, CD3+, CD15+ and CD19+ cells were analyzed. The cases were divided into three groups according to CD14+ and CD3+ cell proportions, namely macrophage-dominated (B), T-lymphocyte-dominated (C) and mixed (D) groups. Average values (mean + SEM) of the proportions of different cell types in the three different phenotypes of inflammation (A) with representative flow cytometry blots (B-D) are shown. n = 7 in macrophage-dominated group, n = 6 in T-lymphocyte-dominated group and n = 3 in mixed group. ***p<0.001
