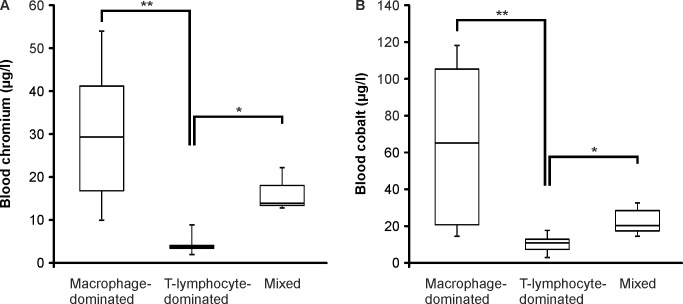
Fig 3. The Blood Chromium and Cobalt Levels.
Whole blood samples were taken preoperatively from the patients and chromium (A) and cobalt (B) concentrations were analyzed by inductively coupled plasma mass spectrometry. Boxplots represent medians and interquartile ranges and whiskers indicate range of values. n = 7 in macrophage-dominated group, n = 5 in T-lymphocyte-dominated group and n = 3 in mixed group. *p<0.05, **p<0.01

