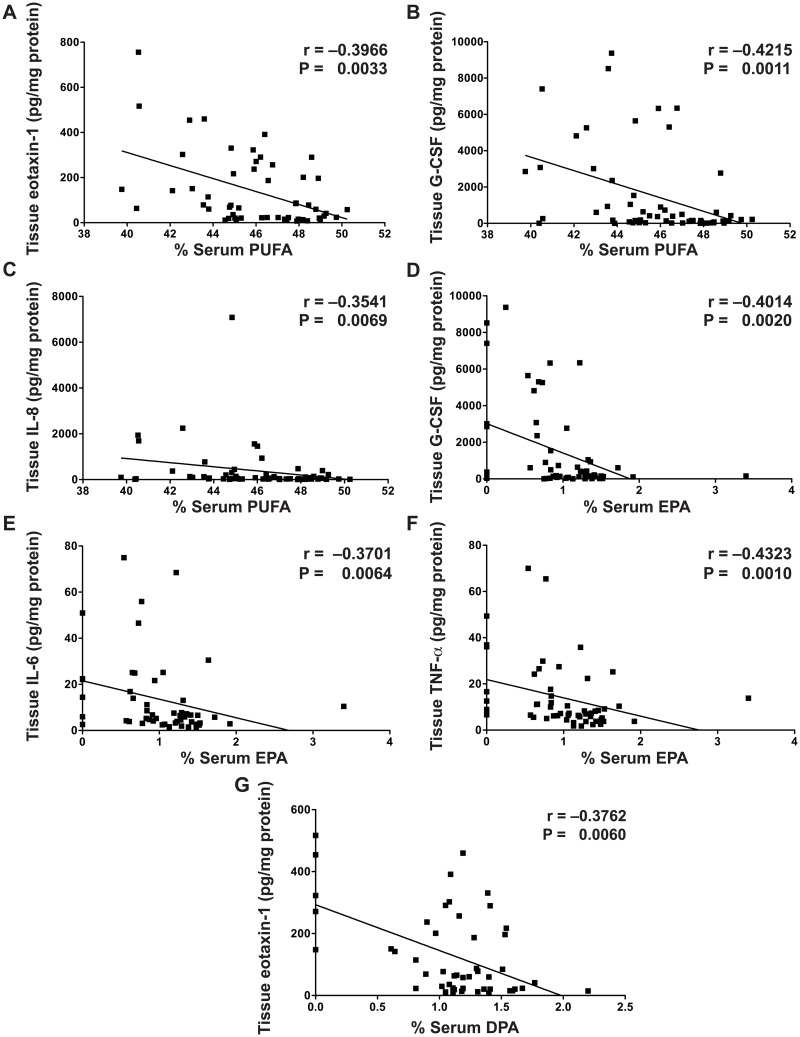
Fig 3. Tissue cytokines are inversely correlated with percent serum PUFA, EPA, and DPA.
Snap frozen colonic biopsies were lysed and cytokine/chemokine levels were measured by Luminex technology, with each sample corrected for tissue lysate protein concentration, as described in the Methods. Blood was obtained from each subject and processed within 30 min to obtain serum. Serum fatty acid levels were measured as described in the Methods. The Spearman correlation coefficient (r) and the associated P value are shown. (A–C) Inverse correlations with percent serum PUFA. (D–F) Inverse correlations with percent serum EPA. (G) Inverse correlation with percent serum DPA. n = 58 for UC subjects. There were no significant correlations in control subjects (data not shown).

