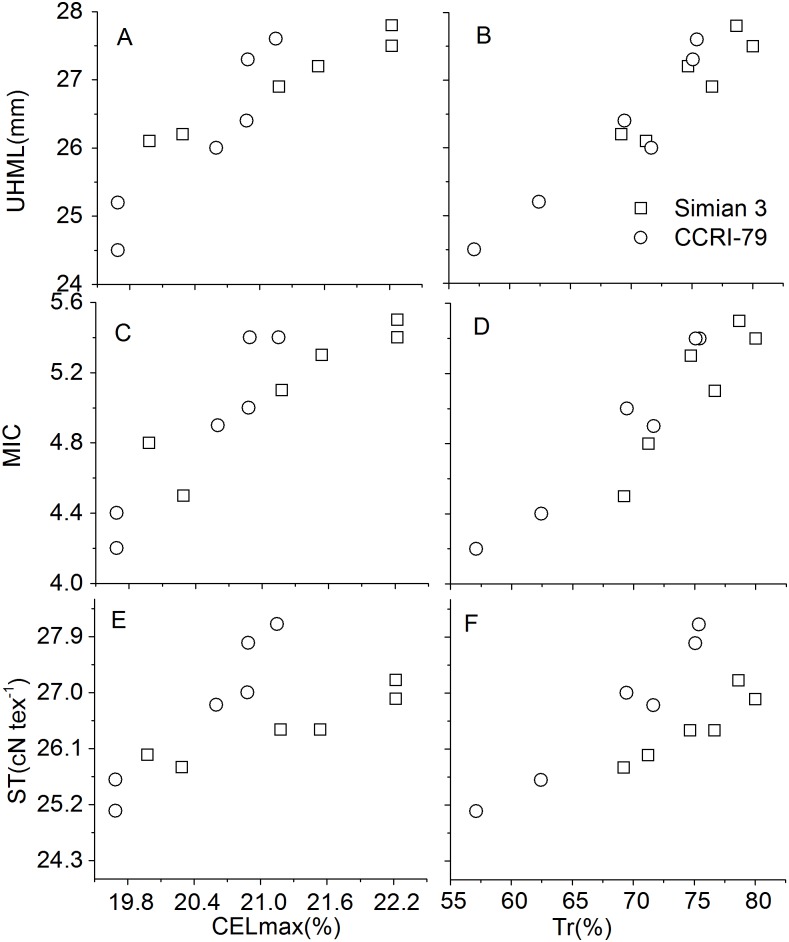
Fig 1. Correlation coefficients among parameters in fibers of two cotton cultivars during 2013–2014.
UHML-fiber upper-half mean length, MIC-micronaire value, ST-fiber strength, CELmax-maximum cellulose content, Tr-sucrose transformation rate. * and **, significant differences at P = 0.01 and P = 0.05 probability levels, respectively. n = 6, R0.05 = 0.811, R0.01 = 0.917.

