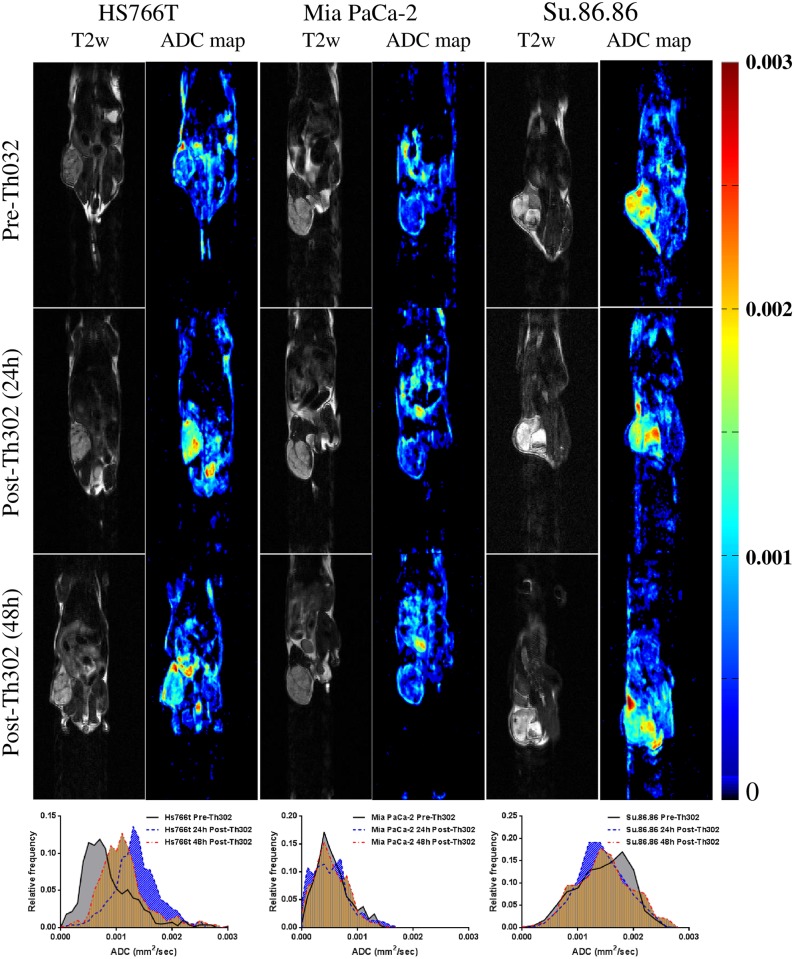
Fig 2. Time-course imaging result of DCE-MRI and DW-MRI.
A) Time-courses of normalized mean Ktrans values. The mean values of normalized Ktrans decreased 69% for TH-302 treated mice in Hs766t tumors, decreased 46% for Mia PaCa-2 tumors and increased 5% in SU.86.86 tumors. B) Changes in normalized mean tumor ADC values over time. A substantial increase in relative mean ADCs was observed for the TH-302 treated group at post- 24 and 48 hours (29% increasing for 24h, p<0.01; 17% increasing for 48h, p<0.01). MIA PaCa-2 is not statistically significant different between conducted groups (8% increasing for 24h, P>0.05; 4% increasing for 48h, p>0.05). For SU.86.86, no significant change was detected by DW-MRI for both TH-302 and control group (3% decreasing for 24h, p>0.05; 0.5% increasing for 48h, p>0.05). The normalization was calculated by the average of the difference of pre- and post-treatment in Th302 group relative to average of the difference of pre- and post-treatment in control group. Error bars stand for standard deviation.

