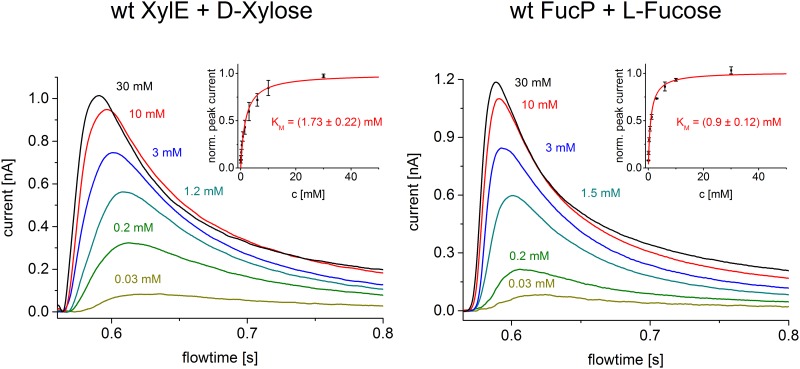
Fig 1. Sugar concentration dependence.
Transient currents obtained with XylE and FucP proteoliposomes after a sugar concentration jump at pH 7.6 using the low time resolution set up. The different concentrations of D-Xylose and L-Fucose are indicated. The inset shows mean and standard deviation of the normalized peak currents obtained from three different sensors for all sugar concentrations used. The Km was determined from a hyperbolic fit.

